| Red | Green | Blue | |
| z | 17.64 | ||
| znorm | Inf | ||
| sky | -Inf | -Inf | -Inf |
| S/N | 35.3 | 51.1 | 58.1 |
| S/N(c) | 0.0 | 0.0 | 0.0 |
| SN(E/C) |
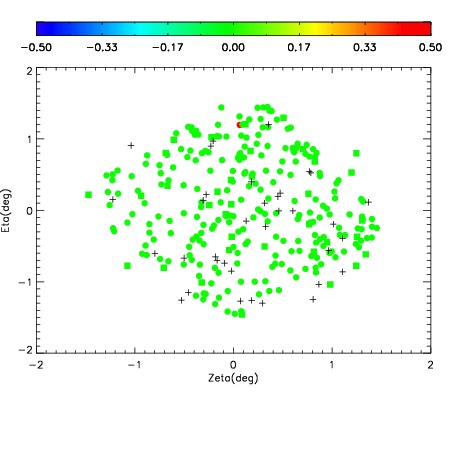
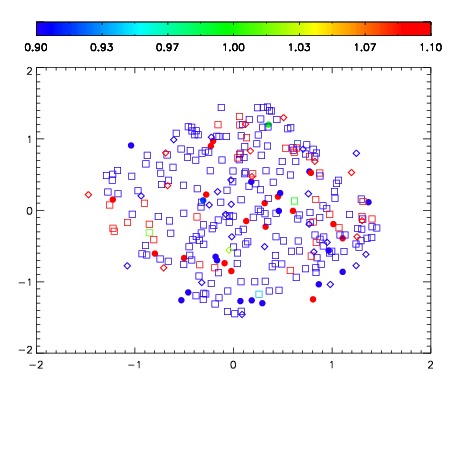


| Frame | Nreads | Zeropoints | Mag plots | Spatial mag deviation | Spatial sky 16325A emission deviations (filled: sky, open: star) | Spatial sky continuum emission | Spatial sky telluric CO2 absorption deviations (filled: H < 10) | |||||||||||||||||||||||
| 0 | 0 |
|
|
|
|
|
|
| IPAIR | NAME | SHIFT | NEWSHIFT | S/N | NAME | SHIFT | NEWSHIFT | S/N |
| 0 | 03120016 | 0.492564 | 0.00000 | 260.023 | 03120017 | 0.00272724 | 0.489837 | 257.778 |
| 1 | 03120015 | 0.491877 | 0.000687003 | 255.773 | 03120014 | 0.00323606 | 0.489328 | 255.053 |
| 2 | 03120012 | 0.491028 | 0.00153598 | 241.807 | 03120013 | 0.00351840 | 0.489046 | 249.984 |
| 3 | 03120011 | 0.488463 | 0.00410098 | 241.054 | 03120010 | 0.00000 | 0.492564 | 244.490 |