| Red | Green | Blue | |
| z | 17.64 | ||
| znorm | Inf | ||
| sky | -Inf | -Inf | -Inf |
| S/N | 30.5 | 50.0 | 54.2 |
| S/N(c) | 0.0 | 0.0 | 0.0 |
| SN(E/C) |
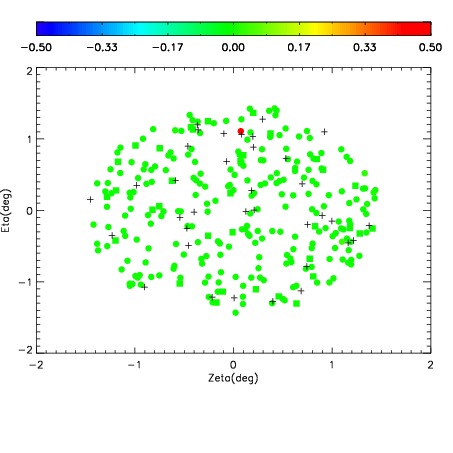
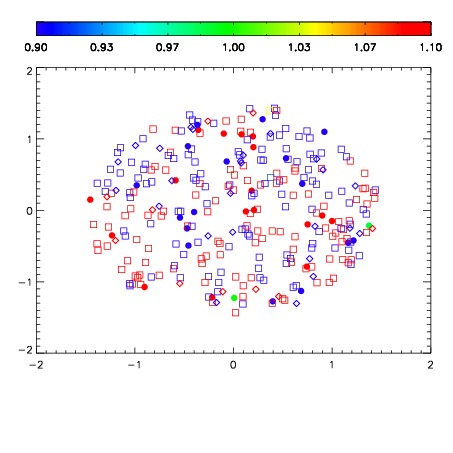


| Frame | Nreads | Zeropoints | Mag plots | Spatial mag deviation | Spatial sky 16325A emission deviations (filled: sky, open: star) | Spatial sky continuum emission | Spatial sky telluric CO2 absorption deviations (filled: H < 10) | |||||||||||||||||||||||
| 0 | 0 |
|
|
|
|
|
|
| IPAIR | NAME | SHIFT | NEWSHIFT | S/N | NAME | SHIFT | NEWSHIFT | S/N |
| 0 | 10200032 | 0.498682 | 0.00000 | 244.623 | 10200033 | 0.000849056 | 0.497833 | 243.411 |
| 1 | 10200031 | 0.498208 | 0.000474006 | 245.983 | 10200030 | 0.00209936 | 0.496583 | 246.196 |
| 2 | 10200028 | 0.495782 | 0.00290000 | 242.421 | 10200029 | 0.00179679 | 0.496885 | 242.931 |
| 3 | 10200027 | 0.495698 | 0.00298399 | 242.007 | 10200026 | 0.00000 | 0.498682 | 237.369 |