| Red | Green | Blue | |
| z | 17.64 | ||
| znorm | Inf | ||
| sky | -NaN | -NaN | -Inf |
| S/N | 26.5 | 45.4 | 47.9 |
| S/N(c) | 0.0 | 0.0 | 0.0 |
| SN(E/C) |


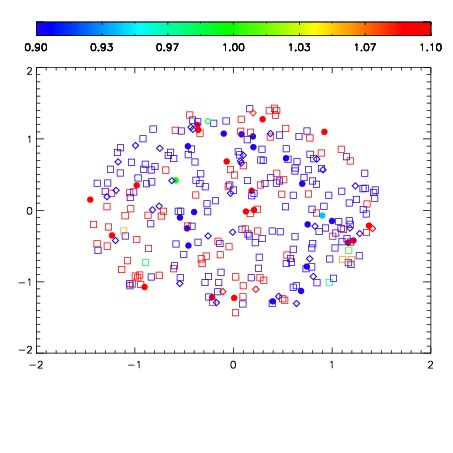


| Frame | Nreads | Zeropoints | Mag plots | Spatial mag deviation | Spatial sky 16325A emission deviations (filled: sky, open: star) | Spatial sky continuum emission | Spatial sky telluric CO2 absorption deviations (filled: H < 10) | |||||||||||||||||||||||
| 0 | 0 |
|
|
|
|
|
|
| IPAIR | NAME | SHIFT | NEWSHIFT | S/N | NAME | SHIFT | NEWSHIFT | S/N |
| 0 | 10250031 | 0.504741 | 0.00000 | 236.129 | 10250030 | 0.00441230 | 0.500329 | 231.299 |
| 1 | 10250032 | 0.504494 | 0.000247002 | 238.433 | 10250033 | 0.00605334 | 0.498688 | 240.522 |
| 2 | 10250027 | 0.502915 | 0.00182599 | 221.964 | 10250029 | 0.00435475 | 0.500386 | 227.009 |
| 3 | 10250028 | 0.503412 | 0.00132900 | 218.806 | 10250026 | 0.00000 | 0.504741 | 216.081 |