| Red | Green | Blue | |
| z | 17.64 | ||
| znorm | Inf | ||
| sky | -NaN | -Inf | -Inf |
| S/N | 25.0 | 43.5 | 46.1 |
| S/N(c) | 0.0 | 0.0 | 0.0 |
| SN(E/C) |
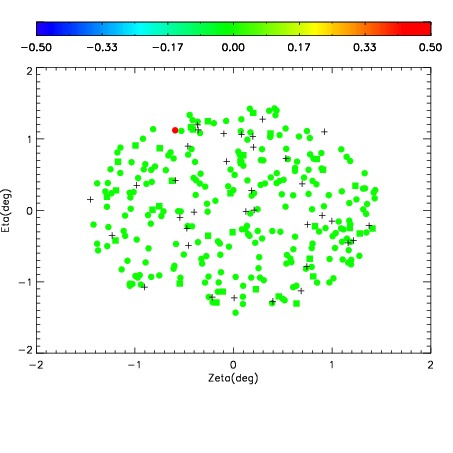
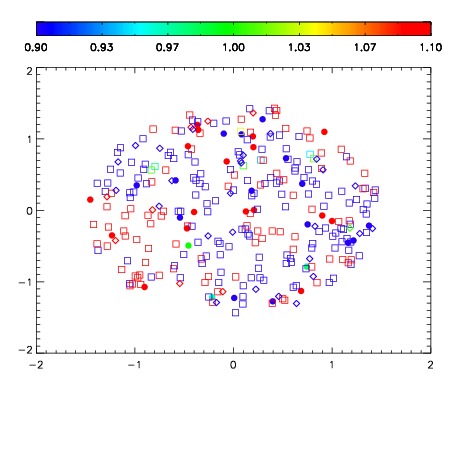
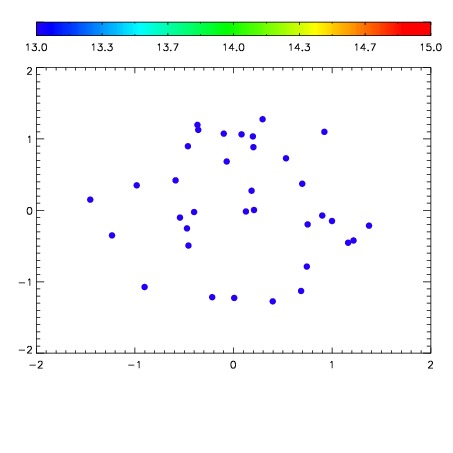

| Frame | Nreads | Zeropoints | Mag plots | Spatial mag deviation | Spatial sky 16325A emission deviations (filled: sky, open: star) | Spatial sky continuum emission | Spatial sky telluric CO2 absorption deviations (filled: H < 10) | |||||||||||||||||||||||
| 0 | 0 |
|
|
|
|
|
|
| IPAIR | NAME | SHIFT | NEWSHIFT | S/N | NAME | SHIFT | NEWSHIFT | S/N |
| 0 | 10460013 | 0.505135 | 0.00000 | 207.424 | 10460018 | 0.00399299 | 0.501142 | 210.042 |
| 1 | 10460016 | 0.504385 | 0.000750005 | 210.798 | 10460014 | 0.00259383 | 0.502541 | 211.162 |
| 2 | 10460017 | 0.504792 | 0.000343025 | 205.488 | 10460015 | 0.00212124 | 0.503014 | 209.586 |
| 3 | 10460012 | 0.504805 | 0.000329971 | 202.998 | 10460011 | 0.00000 | 0.505135 | 195.243 |