| Red | Green | Blue | |
| z | 17.64 | ||
| znorm | Inf | ||
| sky | -Inf | -Inf | -Inf |
| S/N | 30.2 | 50.1 | 54.2 |
| S/N(c) | 0.0 | 0.0 | 0.0 |
| SN(E/C) |
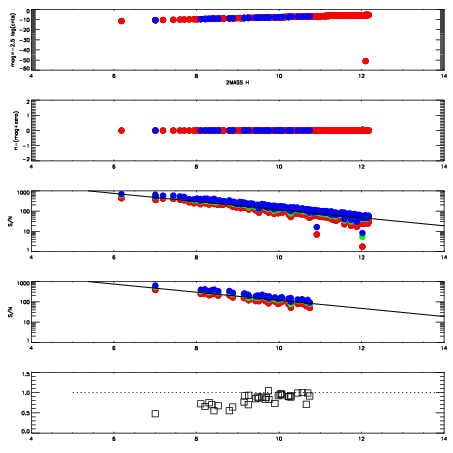
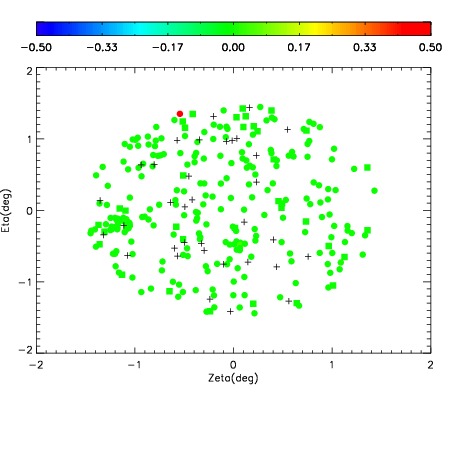
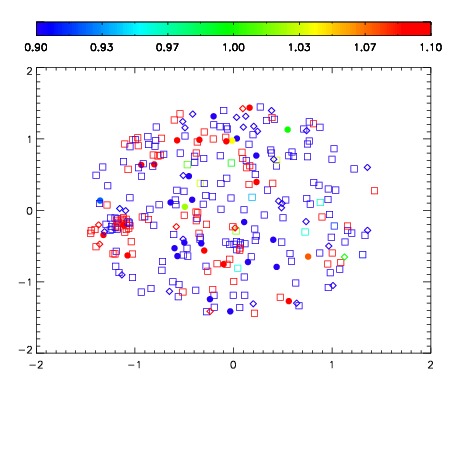
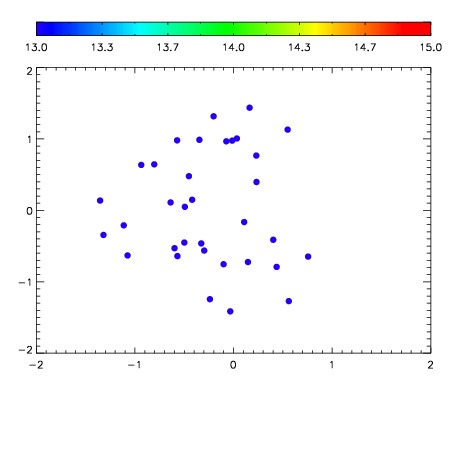

| Frame | Nreads | Zeropoints | Mag plots | Spatial mag deviation | Spatial sky 16325A emission deviations (filled: sky, open: star) | Spatial sky continuum emission | Spatial sky telluric CO2 absorption deviations (filled: H < 10) | |||||||||||||||||||||||
| 0 | 0 |
|
|
|
|
|
|
| IPAIR | NAME | SHIFT | NEWSHIFT | S/N | NAME | SHIFT | NEWSHIFT | S/N |
| 0 | 10220041 | 0.488374 | 0.00000 | 252.037 | 10220046 | -0.00168501 | 0.490059 | 250.012 |
| 1 | 10220044 | 0.487486 | 0.000887990 | 250.568 | 10220042 | -0.000162217 | 0.488536 | 249.715 |
| 2 | 10220040 | 0.487683 | 0.000690997 | 249.444 | 10220039 | 0.00000 | 0.488374 | 248.305 |
| 3 | 10220045 | 0.488258 | 0.000115991 | 248.719 | 10220043 | -2.75361e-05 | 0.488402 | 247.527 |