| Red | Green | Blue | |
| z | 17.64 | ||
| znorm | Inf | ||
| sky | -NaN | -Inf | -Inf |
| S/N | 30.5 | 52.2 | 55.5 |
| S/N(c) | 0.0 | 0.0 | 0.0 |
| SN(E/C) |

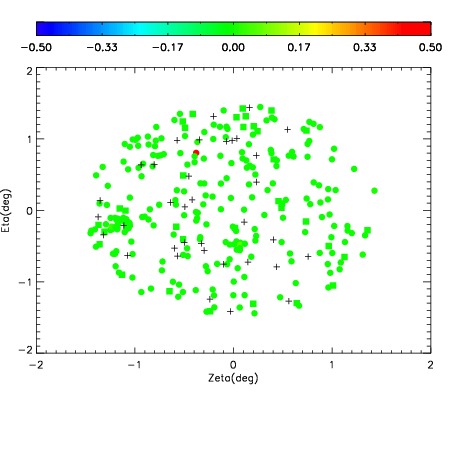
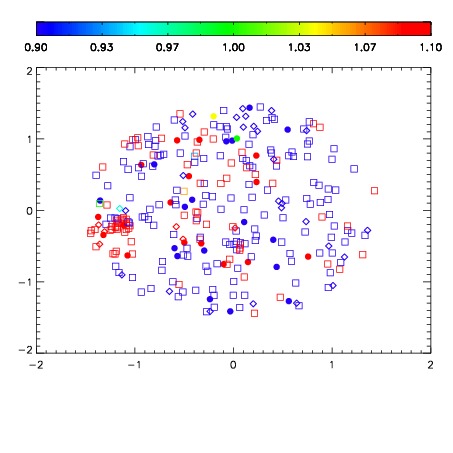
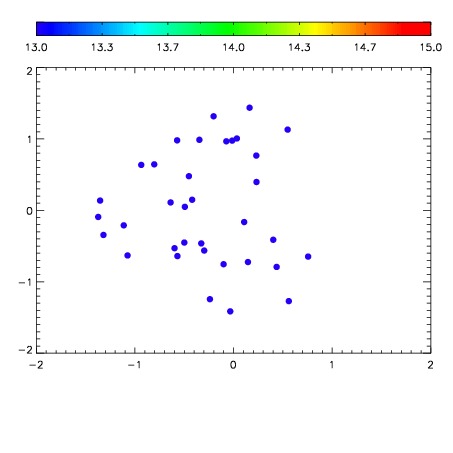

| Frame | Nreads | Zeropoints | Mag plots | Spatial mag deviation | Spatial sky 16325A emission deviations (filled: sky, open: star) | Spatial sky continuum emission | Spatial sky telluric CO2 absorption deviations (filled: H < 10) | |||||||||||||||||||||||
| 0 | 0 |
|
|
|
|
|
|
| IPAIR | NAME | SHIFT | NEWSHIFT | S/N | NAME | SHIFT | NEWSHIFT | S/N |
| 0 | 10260038 | 0.488867 | 0.00000 | 251.697 | 10260043 | -0.00104340 | 0.489910 | 251.674 |
| 1 | 10260042 | 0.487459 | 0.00140801 | 250.580 | 10260040 | -0.000975870 | 0.489843 | 251.282 |
| 2 | 10260041 | 0.487191 | 0.00167602 | 250.357 | 10260039 | -0.000967844 | 0.489835 | 248.087 |
| 3 | 10260037 | 0.488543 | 0.000324011 | 246.005 | 10260036 | 0.00000 | 0.488867 | 243.490 |