| Red | Green | Blue | |
| z | 17.64 | ||
| znorm | Inf | ||
| sky | -NaN | -Inf | -Inf |
| S/N | 26.8 | 46.5 | 49.5 |
| S/N(c) | 0.0 | 0.0 | 0.0 |
| SN(E/C) |
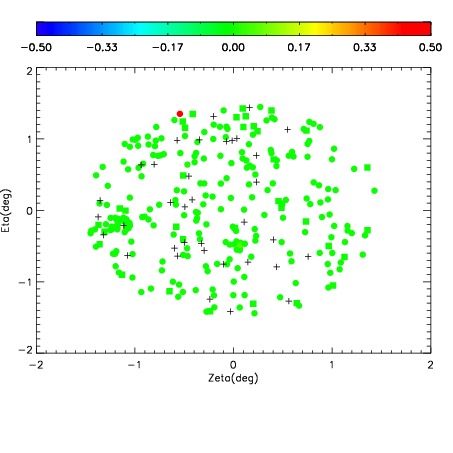
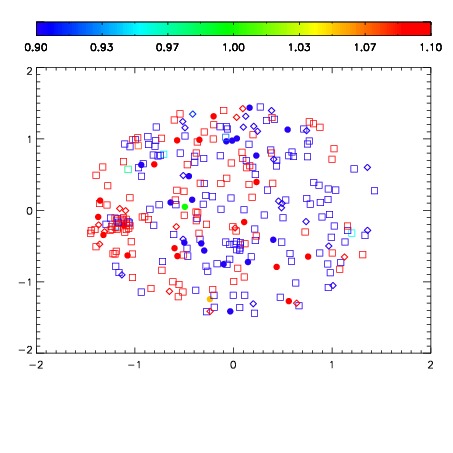
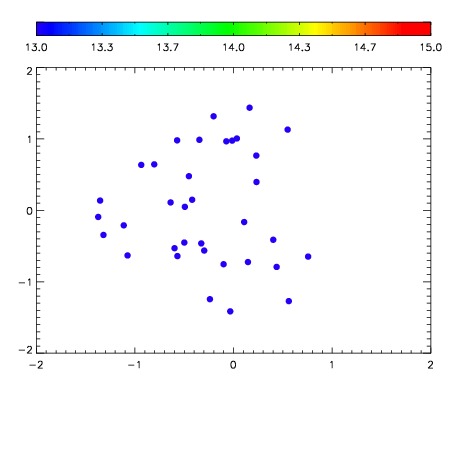

| Frame | Nreads | Zeropoints | Mag plots | Spatial mag deviation | Spatial sky 16325A emission deviations (filled: sky, open: star) | Spatial sky continuum emission | Spatial sky telluric CO2 absorption deviations (filled: H < 10) | |||||||||||||||||||||||
| 0 | 0 |
|
|
|
|
|
|
| IPAIR | NAME | SHIFT | NEWSHIFT | S/N | NAME | SHIFT | NEWSHIFT | S/N |
| 0 | 10540028 | 0.502009 | 0.00000 | 235.718 | 10540033 | 0.00199139 | 0.500018 | 242.552 |
| 1 | 10540027 | 0.501782 | 0.000226974 | 252.504 | 10540026 | 0.00000 | 0.502009 | 253.036 |
| 2 | 10540032 | 0.501281 | 0.000727952 | 243.677 | 10540029 | 0.00515577 | 0.496853 | 251.306 |
| 3 | 10540031 | 0.500790 | 0.00121897 | 230.268 | 10540030 | 0.00450737 | 0.497502 | 240.719 |