| Red | Green | Blue | |
| z | 17.64 | ||
| znorm | Inf | ||
| sky | -Inf | -Inf | -Inf |
| S/N | 31.0 | 53.0 | 54.7 |
| S/N(c) | 0.0 | 0.0 | 0.0 |
| SN(E/C) |
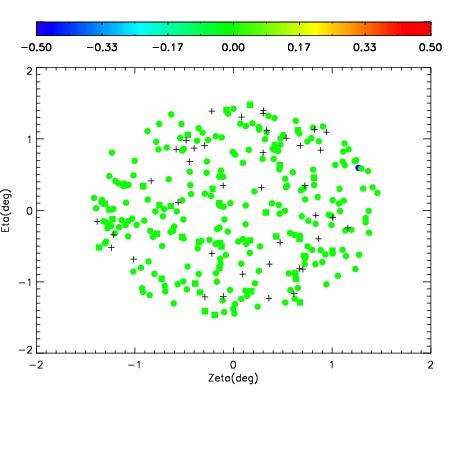
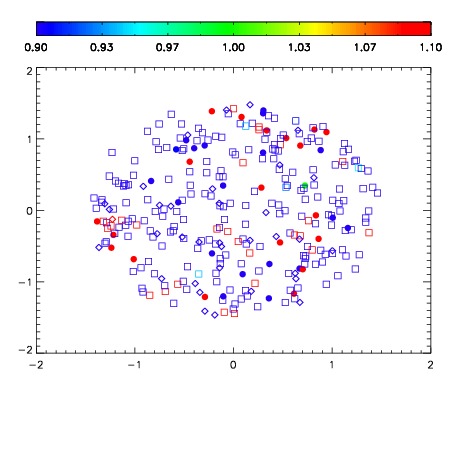
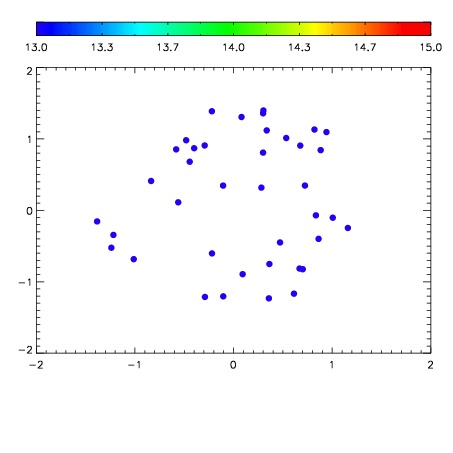

| Frame | Nreads | Zeropoints | Mag plots | Spatial mag deviation | Spatial sky 16325A emission deviations (filled: sky, open: star) | Spatial sky continuum emission | Spatial sky telluric CO2 absorption deviations (filled: H < 10) | |||||||||||||||||||||||
| 0 | 0 |
|
|
|
|
|
|
| IPAIR | NAME | SHIFT | NEWSHIFT | S/N | NAME | SHIFT | NEWSHIFT | S/N |
| 0 | 09720027 | 0.517444 | 0.00000 | 238.212 | 09720032 | -0.000329238 | 0.517773 | 233.406 |
| 1 | 09720031 | 0.514364 | 0.00308001 | 244.986 | 09720025 | 0.00000 | 0.517444 | 239.970 |
| 2 | 09720030 | 0.513930 | 0.00351399 | 242.884 | 09720028 | 0.00120904 | 0.516235 | 234.476 |
| 3 | 09720026 | 0.516710 | 0.000734031 | 233.166 | 09720029 | 0.000354492 | 0.517090 | 229.736 |