| Red | Green | Blue | |
| z | 17.64 | ||
| znorm | Inf | ||
| sky | -Inf | -Inf | -Inf |
| S/N | 27.2 | 46.8 | 50.9 |
| S/N(c) | 0.0 | 0.0 | 0.0 |
| SN(E/C) |
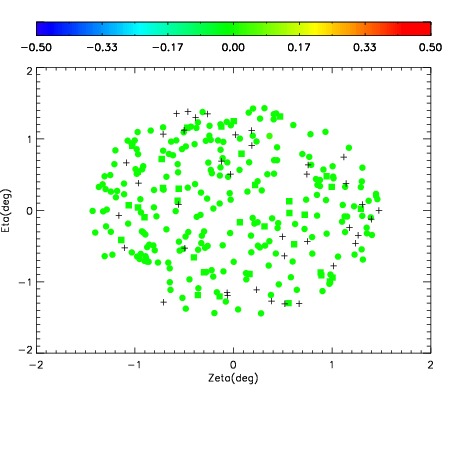
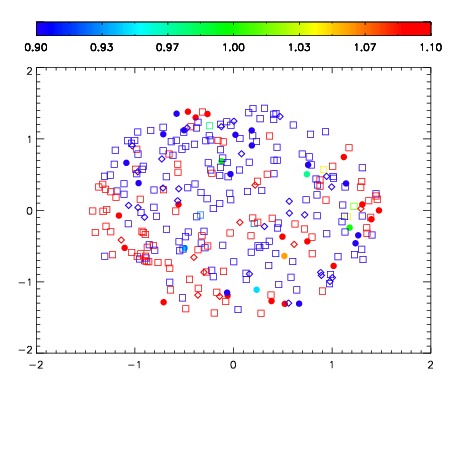
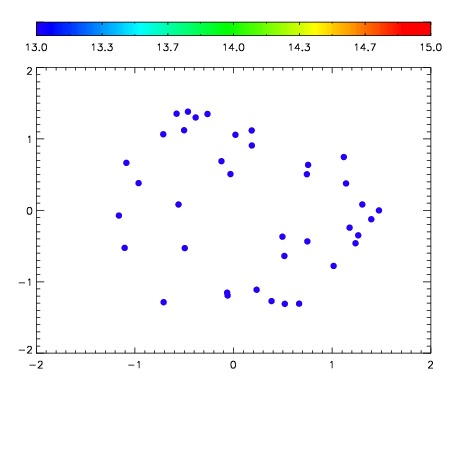

| Frame | Nreads | Zeropoints | Mag plots | Spatial mag deviation | Spatial sky 16325A emission deviations (filled: sky, open: star) | Spatial sky continuum emission | Spatial sky telluric CO2 absorption deviations (filled: H < 10) | |||||||||||||||||||||||
| 0 | 0 |
|
|
|
|
|
|
| IPAIR | NAME | SHIFT | NEWSHIFT | S/N | NAME | SHIFT | NEWSHIFT | S/N |
| 0 | 07000028 | 0.480577 | 0.00000 | 195.422 | 07000022 | 0.00000 | 0.480577 | 194.317 |
| 1 | 07000024 | 0.478900 | 0.00167701 | 203.246 | 07000029 | 0.00210480 | 0.478472 | 204.091 |
| 2 | 07000027 | 0.478520 | 0.00205699 | 203.157 | 07000026 | 0.00245396 | 0.478123 | 200.790 |
| 3 | 07000023 | 0.477901 | 0.00267598 | 201.832 | 07000025 | 0.00232056 | 0.478256 | 200.261 |