| Red | Green | Blue | |
| z | 17.64 | ||
| znorm | Inf | ||
| sky | -Inf | -Inf | -Inf |
| S/N | 27.5 | 46.8 | 49.6 |
| S/N(c) | 0.0 | 0.0 | 0.0 |
| SN(E/C) |
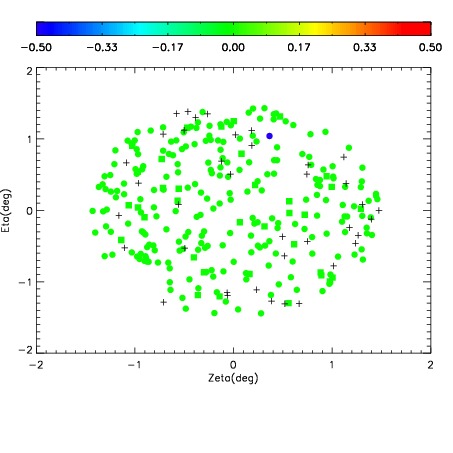
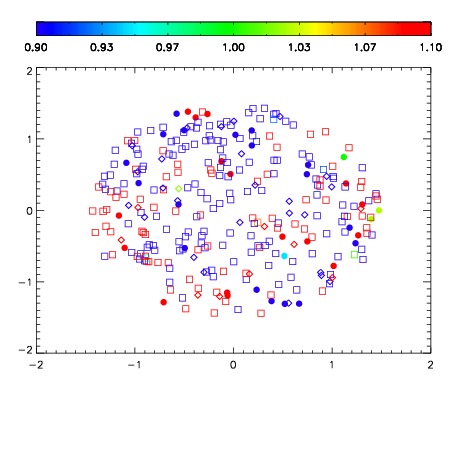
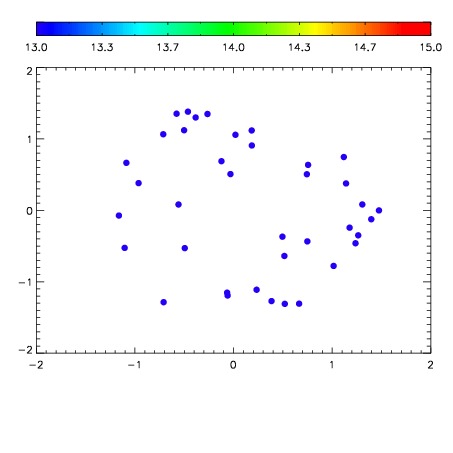

| Frame | Nreads | Zeropoints | Mag plots | Spatial mag deviation | Spatial sky 16325A emission deviations (filled: sky, open: star) | Spatial sky continuum emission | Spatial sky telluric CO2 absorption deviations (filled: H < 10) | |||||||||||||||||||||||
| 0 | 0 |
|
|
|
|
|
|
| IPAIR | NAME | SHIFT | NEWSHIFT | S/N | NAME | SHIFT | NEWSHIFT | S/N |
| 0 | 07230017 | 0.484186 | 0.00000 | 200.118 | 07230014 | -1.61537e-05 | 0.484202 | 197.286 |
| 1 | 07230013 | 0.477141 | 0.00704500 | 200.679 | 07230018 | 0.000336010 | 0.483850 | 203.484 |
| 2 | 07230016 | 0.483310 | 0.000875980 | 198.975 | 07230011 | 0.00000 | 0.484186 | 197.160 |
| 3 | 07230012 | 0.476314 | 0.00787199 | 196.940 | 07230015 | -0.000506324 | 0.484692 | 196.283 |