| Red | Green | Blue | |
| z | 17.64 | ||
| znorm | Inf | ||
| sky | -Inf | -Inf | -Inf |
| S/N | 31.8 | 53.1 | 60.2 |
| S/N(c) | 0.0 | 0.0 | 0.0 |
| SN(E/C) |
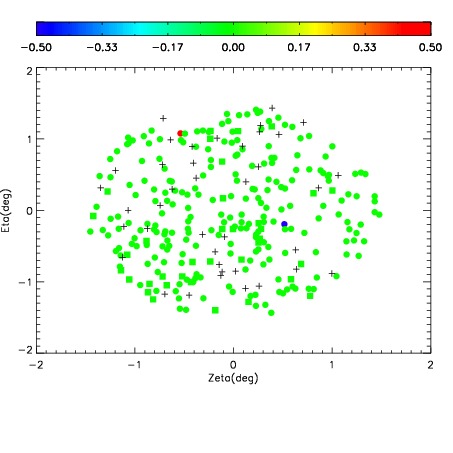
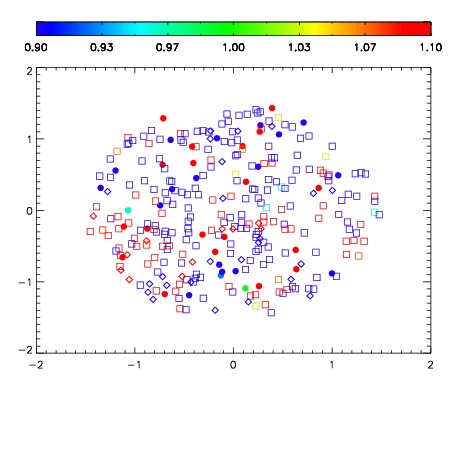


| Frame | Nreads | Zeropoints | Mag plots | Spatial mag deviation | Spatial sky 16325A emission deviations (filled: sky, open: star) | Spatial sky continuum emission | Spatial sky telluric CO2 absorption deviations (filled: H < 10) | |||||||||||||||||||||||
| 0 | 0 |
|
|
|
|
|
|
| IPAIR | NAME | SHIFT | NEWSHIFT | S/N | NAME | SHIFT | NEWSHIFT | S/N |
| 0 | 10230066 | 0.505393 | 0.00000 | 251.825 | 10230068 | 0.00203048 | 0.503363 | 249.726 |
| 1 | 10230065 | 0.505056 | 0.000337005 | 257.988 | 10230064 | 0.00173886 | 0.503654 | 255.398 |
| 2 | 10230069 | 0.502988 | 0.00240505 | 252.287 | 10230063 | 0.00207237 | 0.503321 | 255.294 |
| 3 | 10230062 | 0.505237 | 0.000156045 | 250.295 | 10230067 | 0.00247682 | 0.502916 | 246.730 |
| 4 | 10230061 | 0.504976 | 0.000417054 | 250.282 | 10230060 | 0.00000 | 0.505393 | 246.702 |