| Red | Green | Blue | |
| z | 17.64 | ||
| znorm | Inf | ||
| sky | -Inf | -Inf | -Inf |
| S/N | 10.0 | 18.1 | 20.9 |
| S/N(c) | 0.0 | 0.0 | 0.0 |
| SN(E/C) |
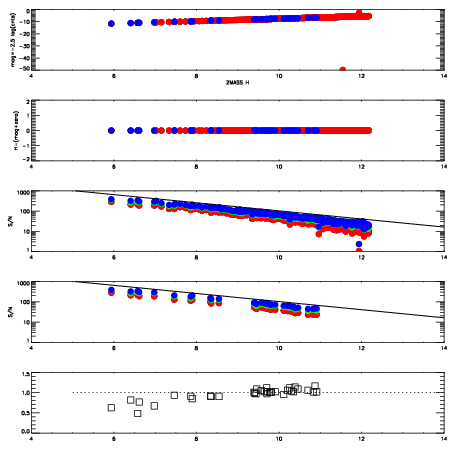
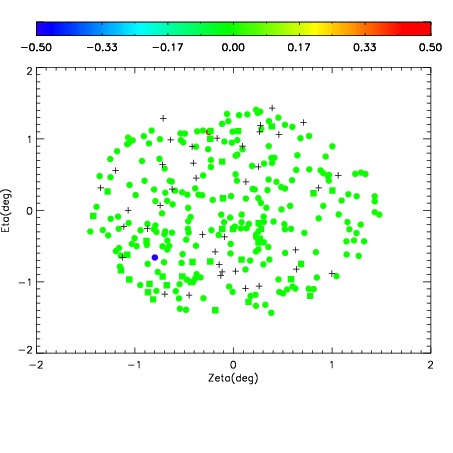
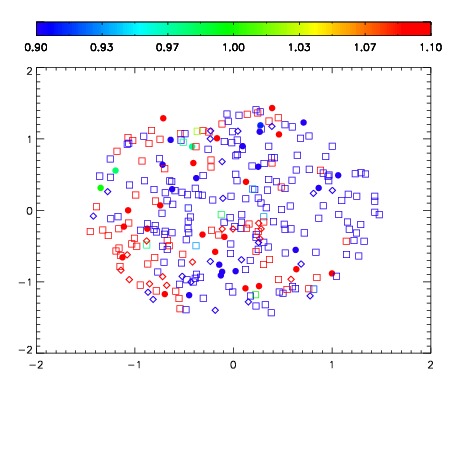
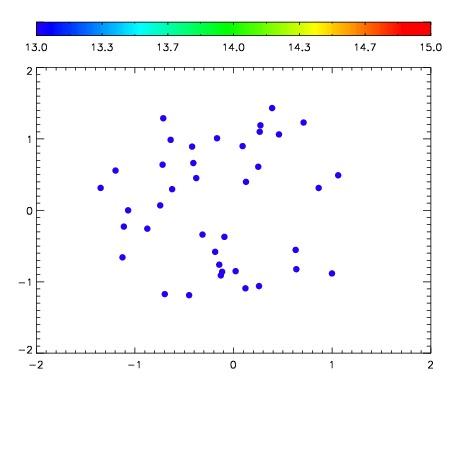

| Frame | Nreads | Zeropoints | Mag plots | Spatial mag deviation | Spatial sky 16325A emission deviations (filled: sky, open: star) | Spatial sky continuum emission | Spatial sky telluric CO2 absorption deviations (filled: H < 10) | |||||||||||||||||||||||
| 0 | 0 |
|
|
|
|
|
|
| IPAIR | NAME | SHIFT | NEWSHIFT | S/N | NAME | SHIFT | NEWSHIFT | S/N |
| 0 | 10270060 | 0.499216 | 0.00000 | 82.2683 | 10270062 | 0.000960101 | 0.498256 | 12.3027 |
| 1 | 10270056 | 0.495448 | 0.00376800 | 165.997 | 10270055 | 0.00000 | 0.499216 | 190.454 |
| 2 | 10270057 | 0.495585 | 0.00363100 | 143.599 | 10270058 | 0.00190451 | 0.497311 | 63.2249 |