| Red | Green | Blue | |
| z | 17.64 | ||
| znorm | Inf | ||
| sky | -Inf | -Inf | -Inf |
| S/N | 29.4 | 49.4 | 55.2 |
| S/N(c) | 0.0 | 0.0 | 0.0 |
| SN(E/C) |


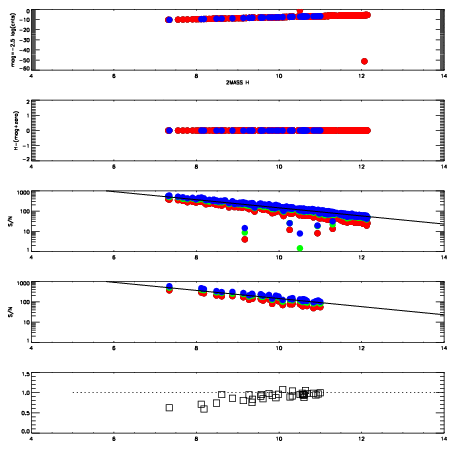
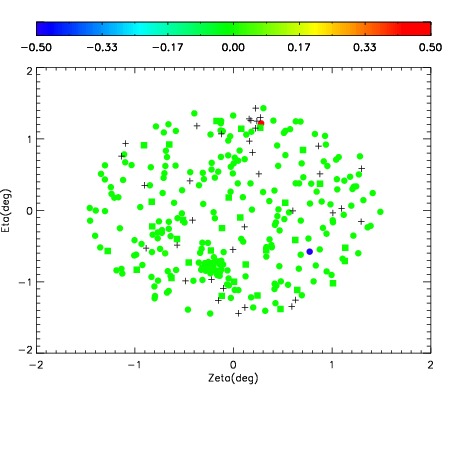
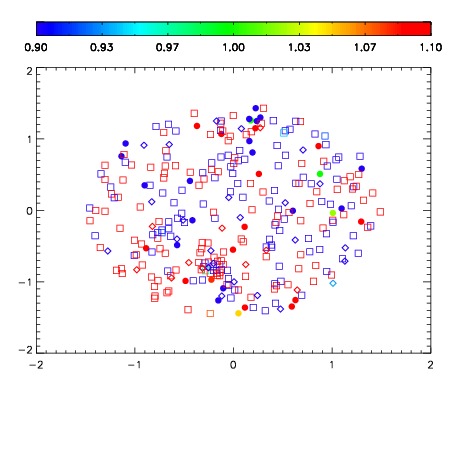
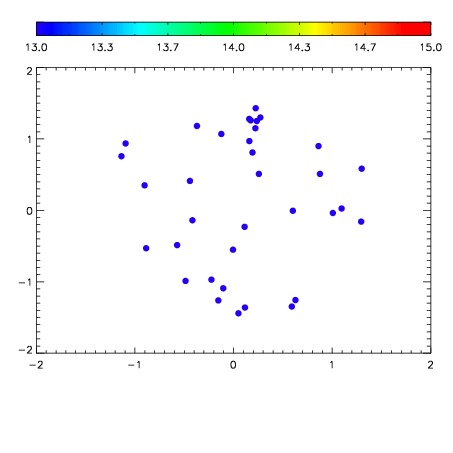
| Frame | Nreads | Zeropoints | Mag plots | Spatial mag deviation | Spatial sky 16325A emission deviations (filled: sky, open: star) | Spatial sky continuum emission | Spatial sky telluric CO2 absorption deviations (filled: H < 10) | |||||||||||||||||||||||
| 0 | 0 |
| 
| 
| 
| 
| 
|
| IPAIR | NAME | SHIFT | NEWSHIFT | S/N | NAME | SHIFT | NEWSHIFT | S/N |
| 0 | 03760016 | 0.503387 | 0.00000 | 194.581 | 03760010 | 0.00000 | 0.503387 | 182.189 |
| 1 | 03760011 | 0.497966 | 0.00542098 | 220.919 | 03760018 | -0.00856888 | 0.511956 | 227.035 |
| 2 | 03760019 | 0.498859 | 0.00452799 | 199.559 | 03760017 | -0.00448129 | 0.507868 | 212.274 |
| 3 | 03760012 | 0.500123 | 0.00326395 | 198.467 | 03760013 | -0.000828070 | 0.504215 | 202.833 |
| 4 | 03760020 | 0.501557 | 0.00182998 | 180.606 | 03760021 | -0.00374918 | 0.507136 | 180.242 |
| 5 | 03760015 | 0.498841 | 0.00454599 | 155.541 | 03760014 | -0.00283550 | 0.506222 | 173.392 |