| Red | Green | Blue | |
| z | 17.64 | ||
| znorm | Inf | ||
| sky | -Inf | -Inf | -Inf |
| S/N | 14.1 | 27.2 | 28.4 |
| S/N(c) | 0.0 | 0.0 | 0.0 |
| SN(E/C) |
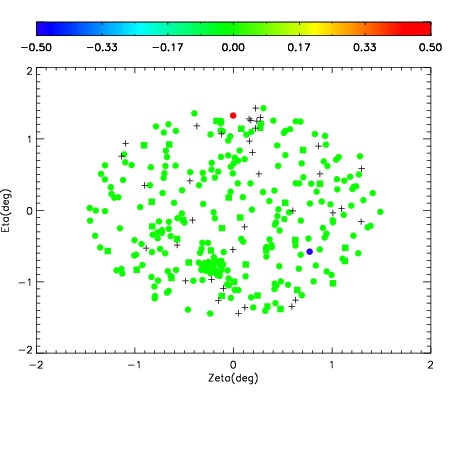
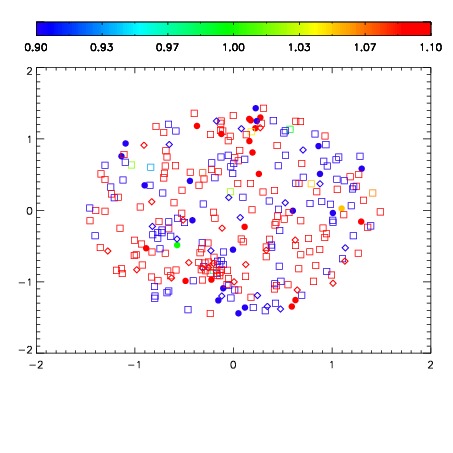
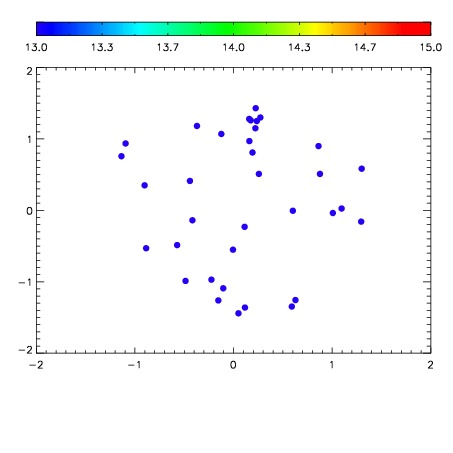

| Frame | Nreads | Zeropoints | Mag plots | Spatial mag deviation | Spatial sky 16325A emission deviations (filled: sky, open: star) | Spatial sky continuum emission | Spatial sky telluric CO2 absorption deviations (filled: H < 10) | |||||||||||||||||||||||
| 0 | 0 |
|
|
|
|
|
|
| IPAIR | NAME | SHIFT | NEWSHIFT | S/N | NAME | SHIFT | NEWSHIFT | S/N |
| 0 | 07240017 | 0.473938 | 0.00000 | 140.130 | 07240011 | 0.00000 | 0.473938 | 143.441 |
| 1 | 07240013 | 0.473584 | 0.000353992 | 179.139 | 07240014 | 0.00103065 | 0.472907 | 169.494 |
| 2 | 07240012 | 0.473683 | 0.000254989 | 163.162 | 07240015 | -0.00211110 | 0.476049 | 154.268 |
| 3 | 07240016 | 0.473928 | 9.98378e-06 | 115.586 | 07240018 | 0.000697825 | 0.473240 | 107.615 |