| Red | Green | Blue | |
| z | 17.64 | ||
| znorm | Inf | ||
| sky | -Inf | -Inf | -Inf |
| S/N | 28.9 | 50.4 | 54.1 |
| S/N(c) | 0.0 | 0.0 | 0.0 |
| SN(E/C) |

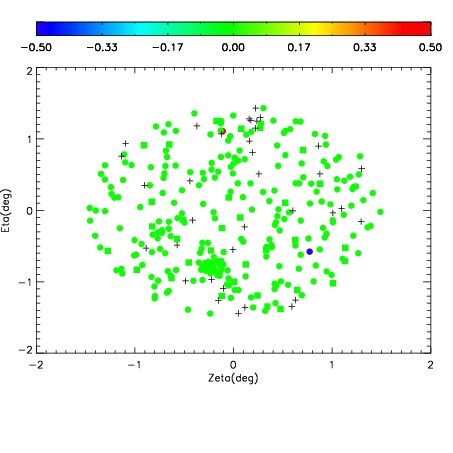
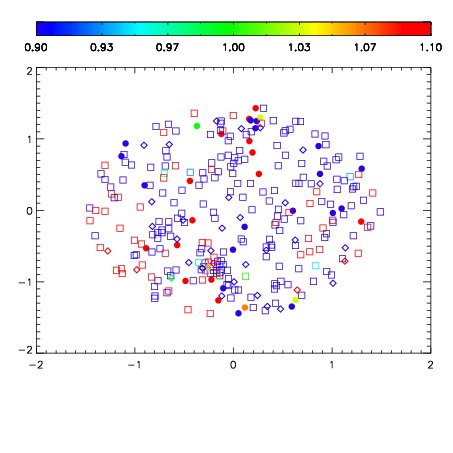
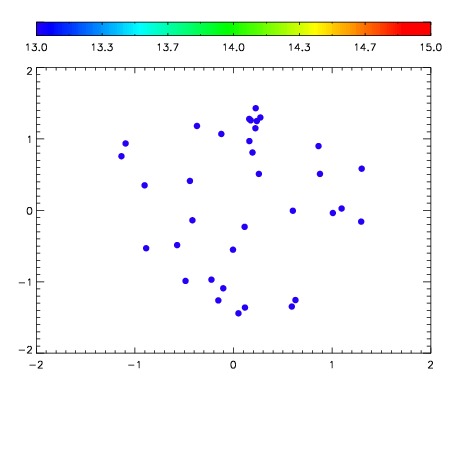

| Frame | Nreads | Zeropoints | Mag plots | Spatial mag deviation | Spatial sky 16325A emission deviations (filled: sky, open: star) | Spatial sky continuum emission | Spatial sky telluric CO2 absorption deviations (filled: H < 10) | |||||||||||||||||||||||
| 0 | 0 |
|
|
|
|
|
|
| IPAIR | NAME | SHIFT | NEWSHIFT | S/N | NAME | SHIFT | NEWSHIFT | S/N |
| 0 | 09980050 | 0.520812 | 0.00000 | 244.162 | 09980051 | 8.13403e-05 | 0.520731 | 239.797 |
| 1 | 09980054 | 0.520231 | 0.000580966 | 246.102 | 09980055 | -0.00205467 | 0.522867 | 243.327 |
| 2 | 09980053 | 0.520735 | 7.69496e-05 | 244.896 | 09980052 | -0.000170530 | 0.520983 | 241.899 |
| 3 | 09980049 | 0.520638 | 0.000173986 | 238.918 | 09980048 | 0.00000 | 0.520812 | 214.482 |