| Red | Green | Blue | |
| z | 17.64 | ||
| znorm | Inf | ||
| sky | -Inf | -NaN | -Inf |
| S/N | 34.4 | 58.5 | 63.7 |
| S/N(c) | 0.0 | 0.0 | 0.0 |
| SN(E/C) |
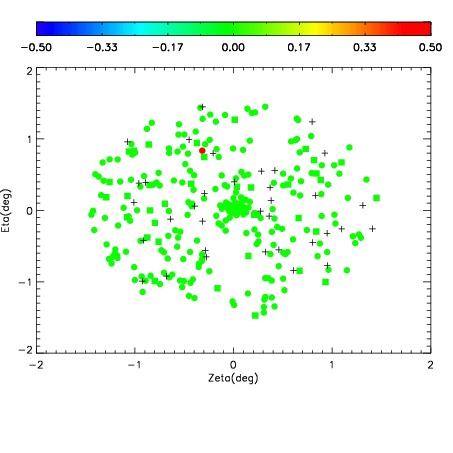
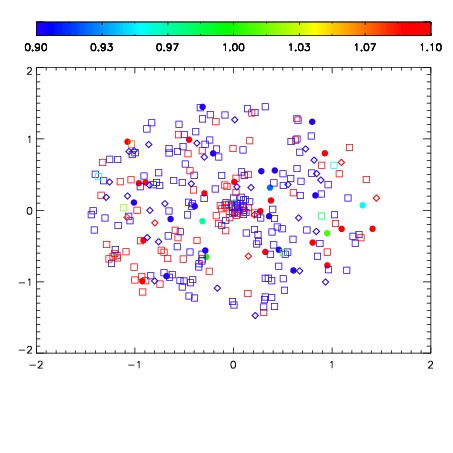
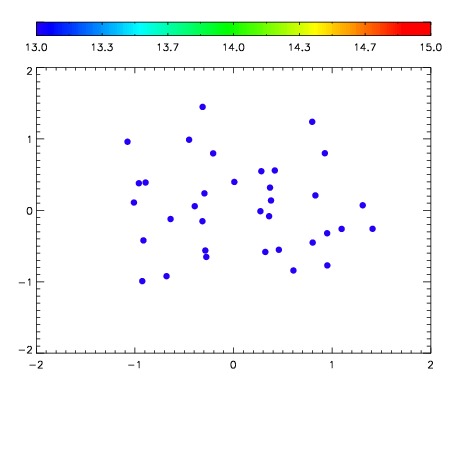

| Frame | Nreads | Zeropoints | Mag plots | Spatial mag deviation | Spatial sky 16325A emission deviations (filled: sky, open: star) | Spatial sky continuum emission | Spatial sky telluric CO2 absorption deviations (filled: H < 10) | |||||||||||||||||||||||
| 0 | 0 |
|
|
|
|
|
|
| IPAIR | NAME | SHIFT | NEWSHIFT | S/N | NAME | SHIFT | NEWSHIFT | S/N |
| 0 | 03410094 | 0.497947 | 0.00000 | 186.512 | 03410100 | -0.000941496 | 0.498888 | 193.803 |
| 1 | 03410093 | 0.494598 | 0.00334901 | 201.492 | 03410092 | 0.00000 | 0.497947 | 198.125 |
| 2 | 03410098 | 0.492513 | 0.00543401 | 195.252 | 03410095 | -0.000478700 | 0.498426 | 196.662 |
| 3 | 03410097 | 0.489016 | 0.00893101 | 191.351 | 03410096 | 0.000728710 | 0.497218 | 194.609 |
| 4 | 03410102 | 0.491222 | 0.00672501 | 178.012 | 03410099 | -0.000340658 | 0.498288 | 193.156 |