| Red | Green | Blue | |
| z | 17.64 | ||
| znorm | Inf | ||
| sky | -Inf | -NaN | -Inf |
| S/N | 18.3 | 35.4 | 37.7 |
| S/N(c) | 0.0 | 0.0 | 0.0 |
| SN(E/C) |
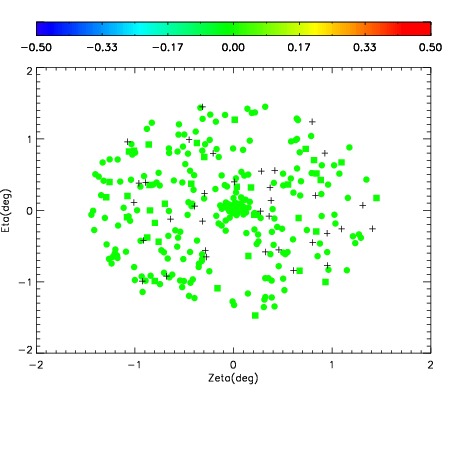
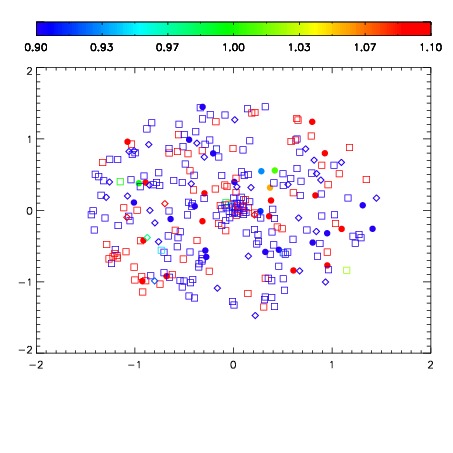


| Frame | Nreads | Zeropoints | Mag plots | Spatial mag deviation | Spatial sky 16325A emission deviations (filled: sky, open: star) | Spatial sky continuum emission | Spatial sky telluric CO2 absorption deviations (filled: H < 10) | |||||||||||||||||||||||
| 0 | 0 |
|
|
|
|
|
|
| IPAIR | NAME | SHIFT | NEWSHIFT | S/N | NAME | SHIFT | NEWSHIFT | S/N |
| 0 | 03680073 | 0.497724 | 0.00000 | 192.259 | 03680074 | 0.000362067 | 0.497362 | 193.692 |
| 1 | 03680072 | 0.494572 | 0.00315198 | 189.729 | 03680075 | -0.00164706 | 0.499371 | 186.469 |
| 2 | 03680076 | 0.491425 | 0.00629899 | 183.846 | 03680078 | -0.000216865 | 0.497941 | 184.237 |
| 3 | 03680077 | 0.495651 | 0.00207299 | 181.072 | 03680071 | 0.00000 | 0.497724 | 174.398 |