| Red | Green | Blue | |
| z | 17.64 | ||
| znorm | Inf | ||
| sky | -Inf | -NaN | -Inf |
| S/N | 35.2 | 60.5 | 65.6 |
| S/N(c) | 0.0 | 0.0 | 0.0 |
| SN(E/C) |
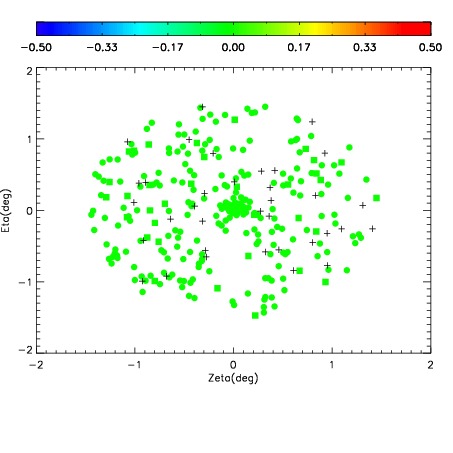
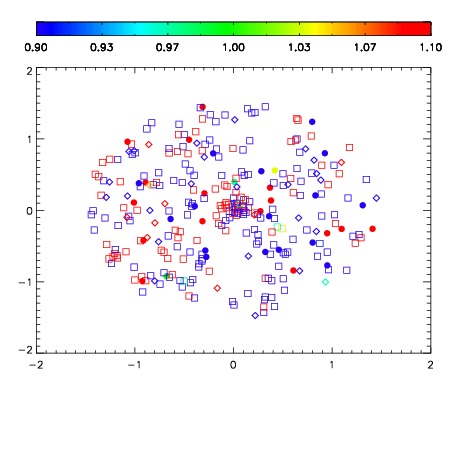
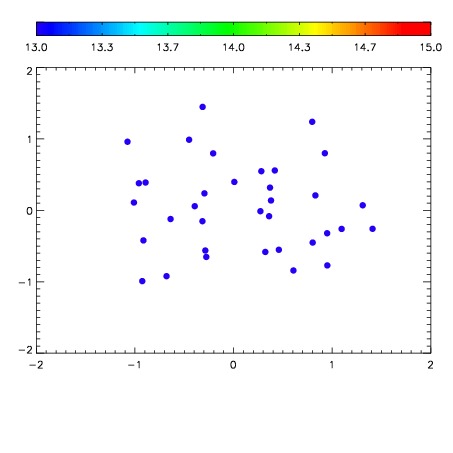

| Frame | Nreads | Zeropoints | Mag plots | Spatial mag deviation | Spatial sky 16325A emission deviations (filled: sky, open: star) | Spatial sky continuum emission | Spatial sky telluric CO2 absorption deviations (filled: H < 10) | |||||||||||||||||||||||
| 0 | 0 |
|
|
|
|
|
|
| IPAIR | NAME | SHIFT | NEWSHIFT | S/N | NAME | SHIFT | NEWSHIFT | S/N |
| 0 | 03720077 | 0.512284 | 0.00000 | 213.243 | 03720082 | 0.000697223 | 0.511587 | 218.719 |
| 1 | 03720081 | 0.510509 | 0.00177497 | 220.730 | 03720074 | 0.00731948 | 0.504964 | 223.917 |
| 2 | 03720080 | 0.509790 | 0.00249398 | 219.497 | 03720079 | -0.000168532 | 0.512452 | 222.327 |
| 3 | 03720073 | 0.504956 | 0.00732797 | 218.680 | 03720075 | 0.00294266 | 0.509341 | 222.196 |
| 4 | 03720076 | 0.510445 | 0.00183898 | 213.423 | 03720071 | 0.00000 | 0.512284 | 221.312 |
| 5 | 03720072 | 0.501677 | 0.0106070 | 208.547 | 03720078 | 0.00135852 | 0.510925 | 209.849 |