| Red | Green | Blue | |
| z | 17.64 | ||
| znorm | Inf | ||
| sky | -Inf | -Inf | -Inf |
| S/N | 21.0 | 37.6 | 41.2 |
| S/N(c) | 0.0 | 0.0 | 0.0 |
| SN(E/C) |

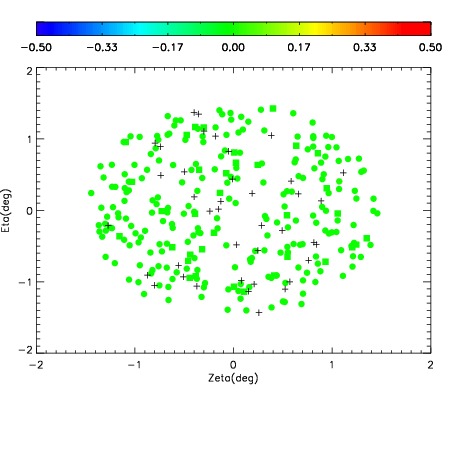
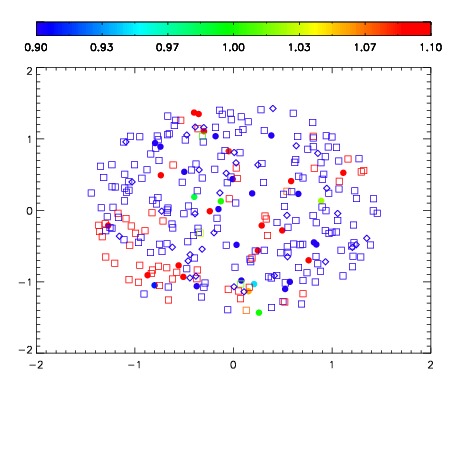
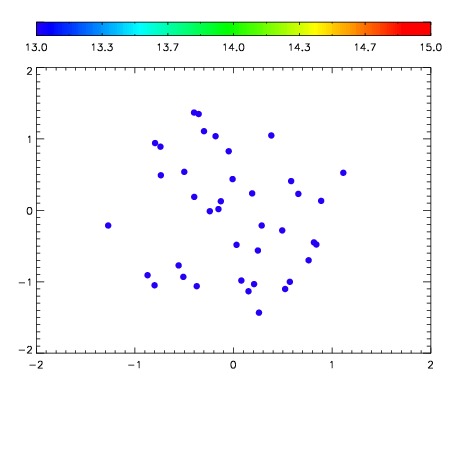

| Frame | Nreads | Zeropoints | Mag plots | Spatial mag deviation | Spatial sky 16325A emission deviations (filled: sky, open: star) | Spatial sky continuum emission | Spatial sky telluric CO2 absorption deviations (filled: H < 10) | |||||||||||||||||||||||
| 0 | 0 |
|
|
|
|
|
|
| IPAIR | NAME | SHIFT | NEWSHIFT | S/N | NAME | SHIFT | NEWSHIFT | S/N |
| 0 | 03440078 | 0.514870 | 0.00000 | 165.007 | 03440079 | 0.00169780 | 0.513172 | 101.042 |
| 1 | 03440074 | 0.513334 | 0.00153601 | 228.351 | 03440075 | 0.00133881 | 0.513531 | 229.077 |
| 2 | 03440073 | 0.507149 | 0.00772101 | 221.701 | 03440072 | 0.00000 | 0.514870 | 224.041 |
| 3 | 03440077 | 0.509377 | 0.00549299 | 172.765 | 03440076 | 0.00156576 | 0.513304 | 219.356 |