| Red | Green | Blue | |
| z | 17.64 | ||
| znorm | Inf | ||
| sky | -Inf | -Inf | -Inf |
| S/N | 25.1 | 45.4 | 47.5 |
| S/N(c) | 0.0 | 0.0 | 0.0 |
| SN(E/C) |
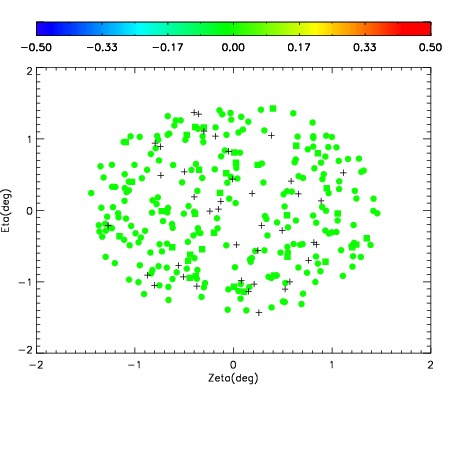
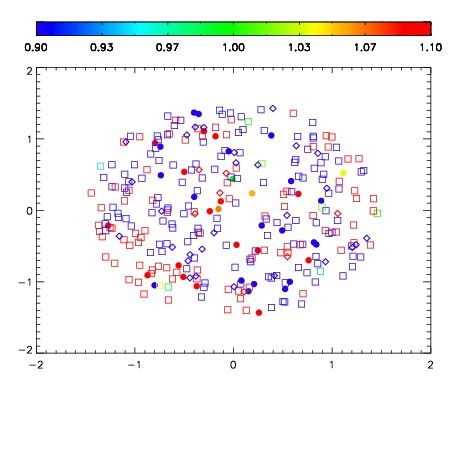
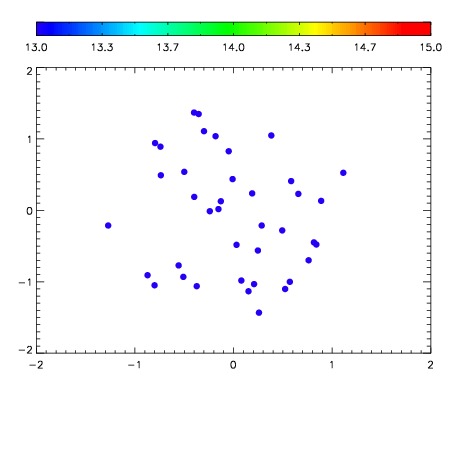

| Frame | Nreads | Zeropoints | Mag plots | Spatial mag deviation | Spatial sky 16325A emission deviations (filled: sky, open: star) | Spatial sky continuum emission | Spatial sky telluric CO2 absorption deviations (filled: H < 10) | |||||||||||||||||||||||
| 0 | 0 |
|
|
|
|
|
|
| IPAIR | NAME | SHIFT | NEWSHIFT | S/N | NAME | SHIFT | NEWSHIFT | S/N |
| 0 | 04560015 | 0.498983 | 0.00000 | 215.565 | 04560013 | 0.00344068 | 0.495542 | 213.580 |
| 1 | 04560016 | 0.498624 | 0.000358999 | 235.031 | 04560017 | 0.00213179 | 0.496851 | 238.654 |
| 2 | 04560012 | 0.497365 | 0.00161800 | 208.394 | 04560014 | 0.00165636 | 0.497327 | 212.798 |
| 3 | 04560011 | 0.496769 | 0.00221398 | 206.342 | 04560010 | 0.00000 | 0.498983 | 210.177 |