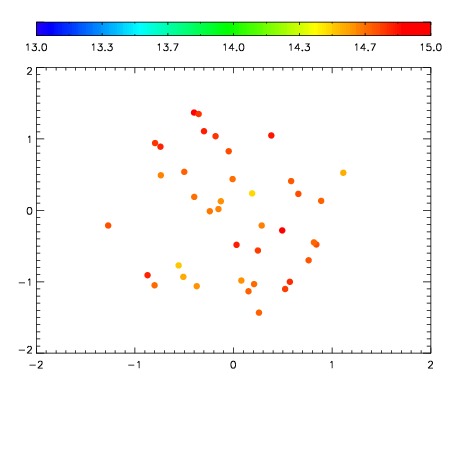
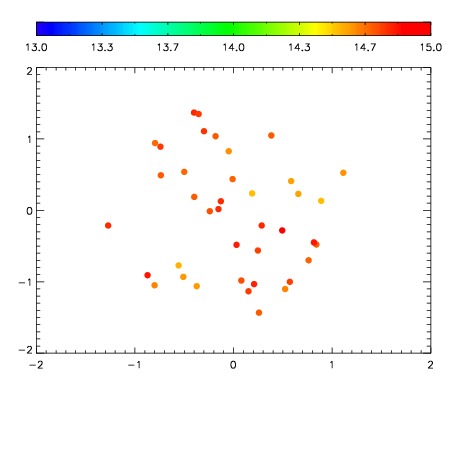
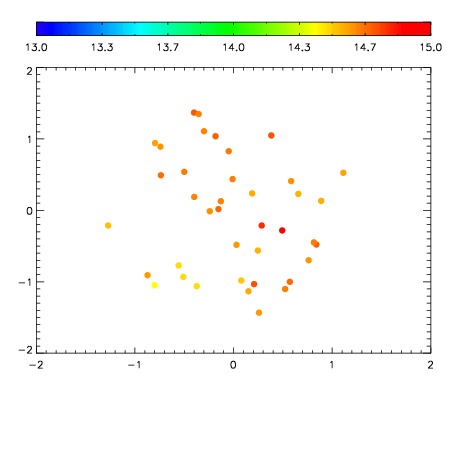
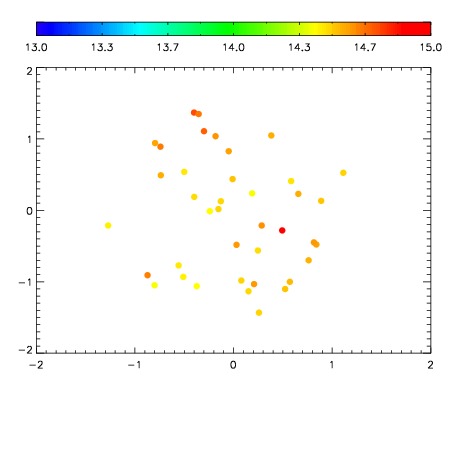
| Frame | Nreads | Zeropoints | Mag plots
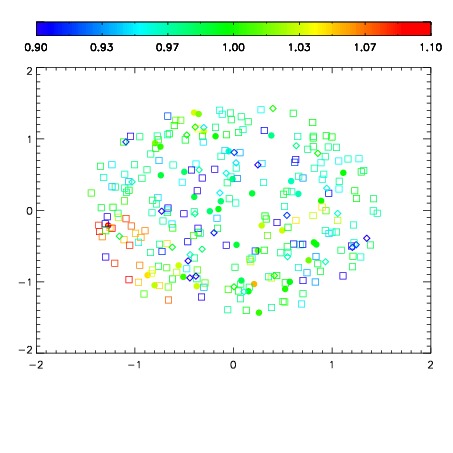
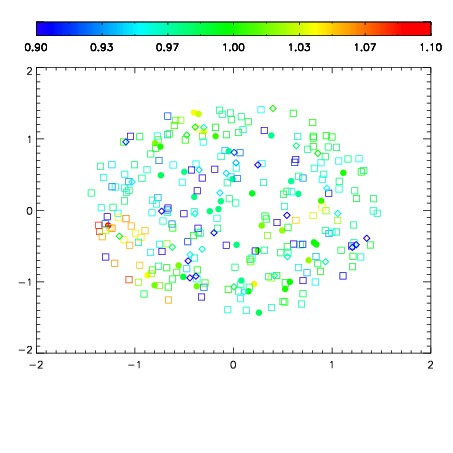
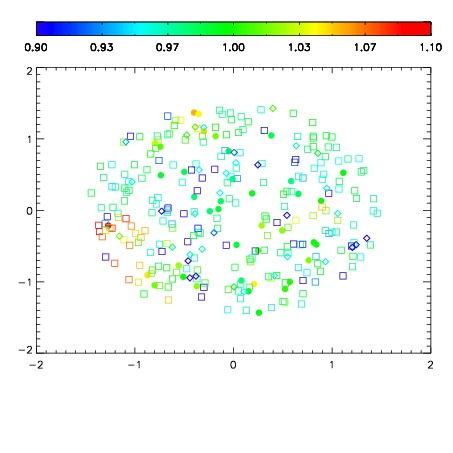
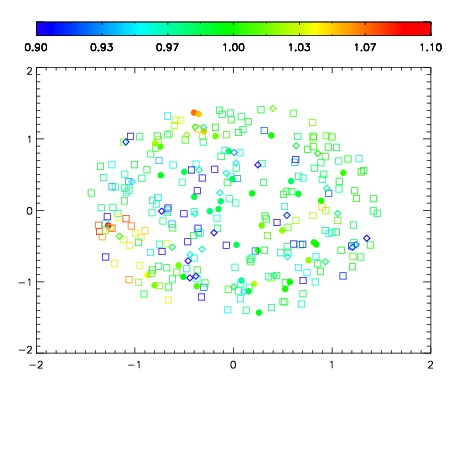
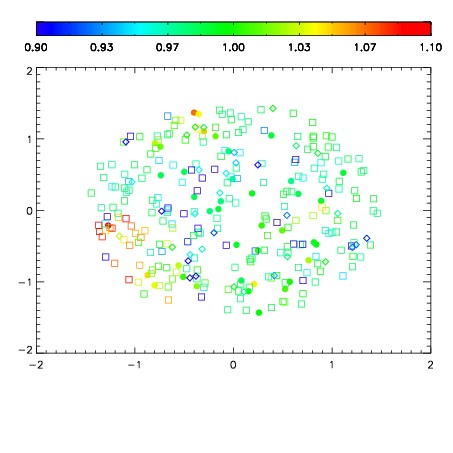
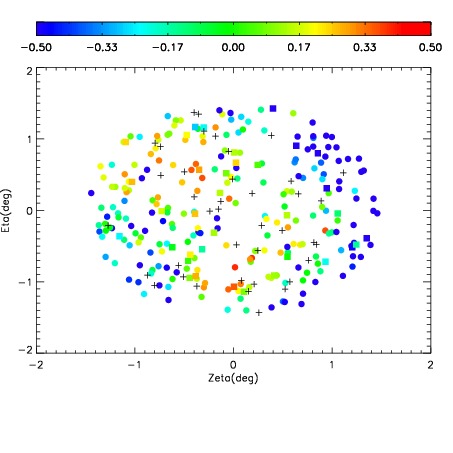
| Spatial mag deviation
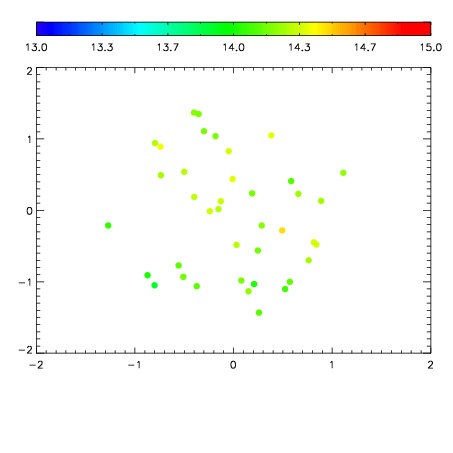
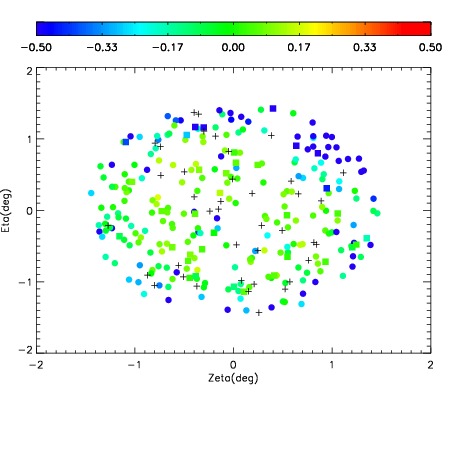
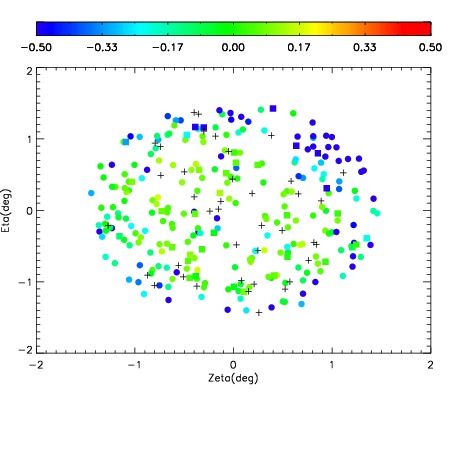
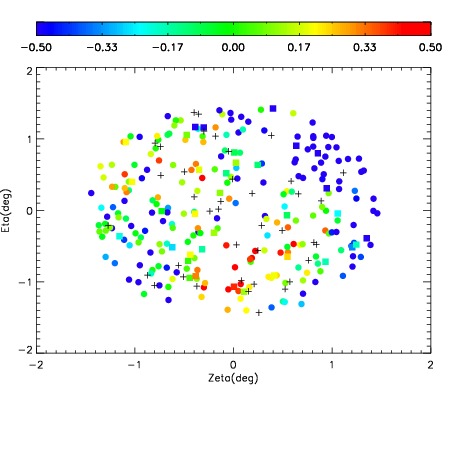
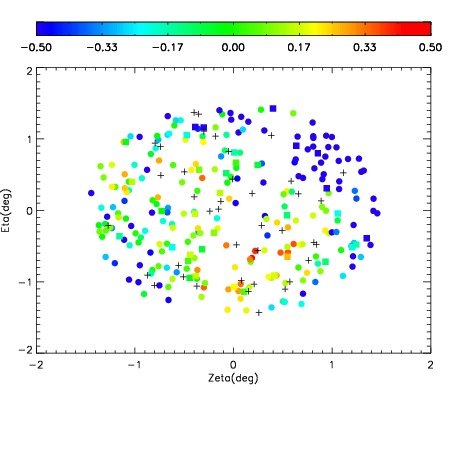
| Spatial sky 16325A emission deviations (filled: sky, open: star)
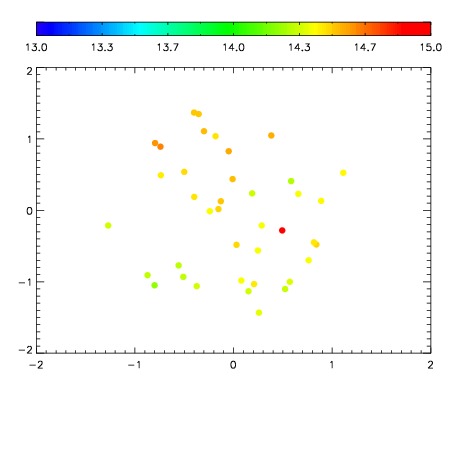
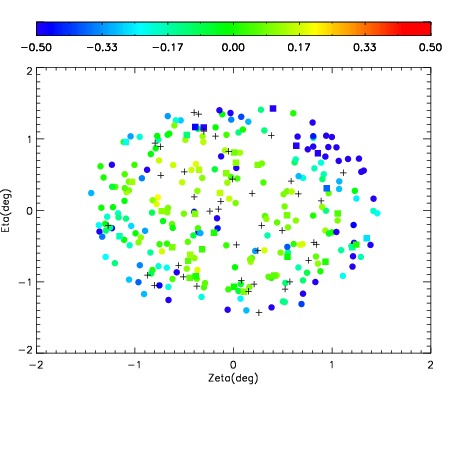
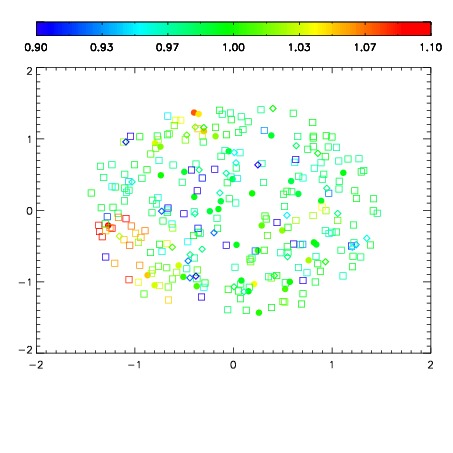
| Spatial sky continuum emission
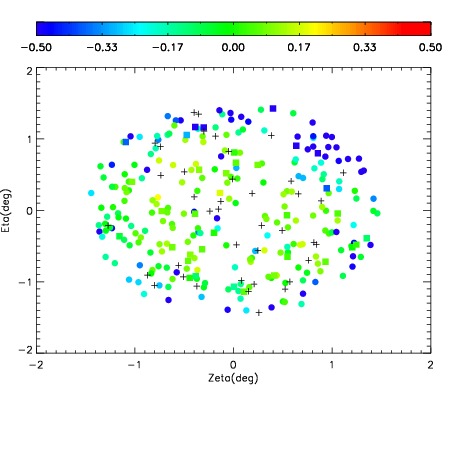
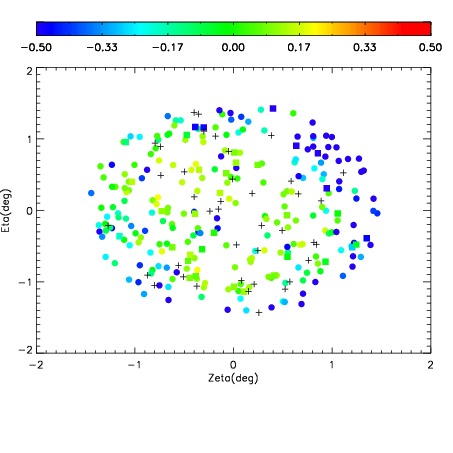
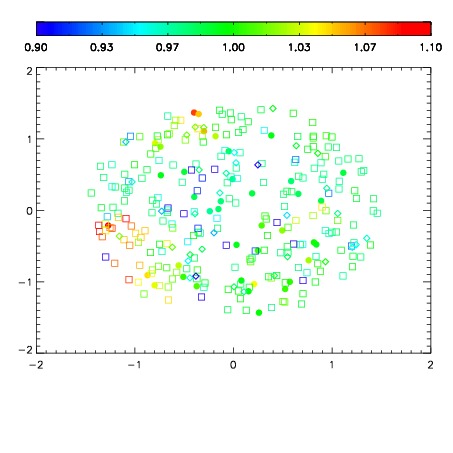
| Spatial sky telluric CO2 absorption deviations (filled: H < 10)
|
| 10820087
| 47
| | Red | Green | Blue
| | z | | 18.94
| | znorm | | 14.76
| | sky | 14.8 | 14.2 | 14.4
| | S/N | 14.4 | 23.2 | 25.5
| | S/N(c) | 12.7 | 21.8 | 24.0
| | SN(E/C) 0.37
|
| 
| 
| 
| 
| 
|
| 10820088
| 47
| | Red | Green | Blue
| | z | | 19.00
| | znorm | | 14.82
| | sky | 14.7 | 14.4 | 14.7
| | S/N | 14.9 | 24.4 | 27.1
| | S/N(c) | 13.0 | 23.2 | 25.5
| | SN(E/C) 0.37
|
| 
| 
| 
| 
| 
|
| 10820089
| 47
| | Red | Green | Blue
| | z | | 19.08
| | znorm | | 14.90
| | sky | 14.8 | 14.5 | 14.7
| | S/N | 15.7 | 25.7 | 28.4
| | S/N(c) | 13.7 | 24.2 | 26.6
| | SN(E/C) 0.36
|
| 
| 
| 
| 
| 
|
| 10820090
| 47
| | Red | Green | Blue
| | z | | 19.05
| | znorm | | 14.87
| | sky | 14.5 | 14.3 | 14.5
| | S/N | 15.3 | 25.0 | 28.0
| | S/N(c) | 13.4 | 23.5 | 26.3
| | SN(E/C) 0.33
|
| 
| 
| 
| 
| 
|
| 10820091
| 47
| | Red | Green | Blue
| | z | | 19.06
| | znorm | | 14.88
| | sky | 15.0 | 14.6 | 14.8
| | S/N | 15.3 | 25.5 | 28.0
| | S/N(c) | 13.5 | 24.1 | 26.6
| | SN(E/C) 0.36
|
| 
| 
| 
| 
| 
|
| 10820092
| 47
| | Red | Green | Blue
| | z | | 19.10
| | znorm | | 14.92
| | sky | 15.1 | 14.7 | 15.0
| | S/N | 15.8 | 26.5 | 28.9
| | S/N(c) | 14.1 | 24.8 | 27.0
| | SN(E/C) 0.36
|
| 
| 
| 
| 
| 
|
| 10820093
| 47
| | Red | Green | Blue
| | z | | 19.06
| | znorm | | 14.88
| | sky | 14.9 | 14.7 | 14.9
| | S/N | 14.8 | 25.2 | 27.5
| | S/N(c) | 13.0 | 23.5 | 26.1
| | SN(E/C) 0.35
|
| 
| 
| 
| 
| 
|
| 10820094
| 47
| | Red | Green | Blue
| | z | | 18.76
| | znorm | | 14.58
| | sky | 14.8 | 14.7 | 14.8
| | S/N | 12.4 | 21.3 | 23.6
| | S/N(c) | 10.7 | 19.4 | 22.2
| | SN(E/C) 0.42
|
| 
| 
| 
| 
| 
|
| 10820095
| 47
| | Red | Green | Blue
| | z | | 18.55
| | znorm | | 14.37
| | sky | 14.8 | 14.6 | 14.9
| | S/N | 10.6 | 17.9 | 20.9
| | S/N(c) | 9.3 | 16.2 | 19.5
| | SN(E/C) 0.46
|
| 
| 
| 
| 
| 
|
| 10820096
| 47
| | Red | Green | Blue
| | z | | 18.74
| | znorm | | 14.56
| | sky | 14.8 | 14.5 | 14.6
| | S/N | 12.5 | 19.4 | 23.3
| | S/N(c) | 10.7 | 18.3 | 21.8
| | SN(E/C) 0.43
|
| 
| 
| 
| 
| 
|