| Red | Green | Blue | |
| z | 17.64 | ||
| znorm | Inf | ||
| sky | -Inf | -Inf | -Inf |
| S/N | 27.7 | 49.4 | 55.4 |
| S/N(c) | 0.0 | 0.0 | 0.0 |
| SN(E/C) |

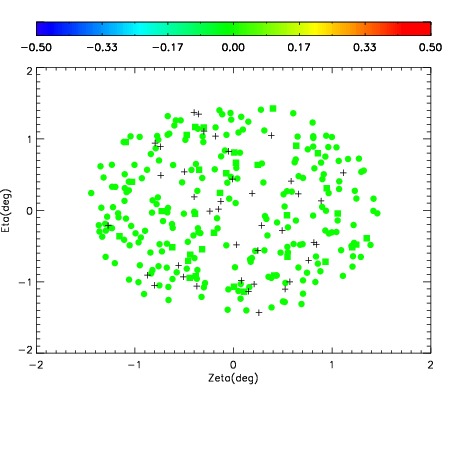
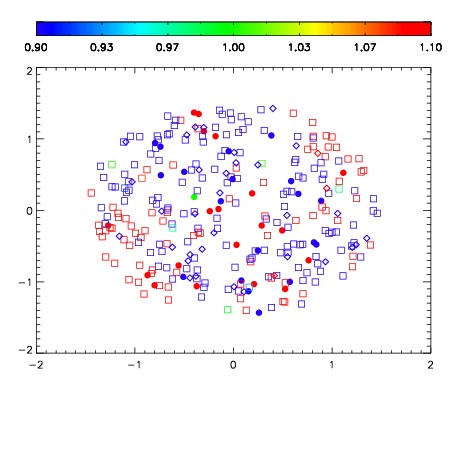
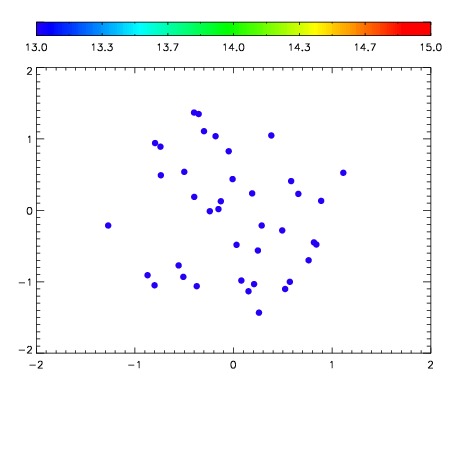

| Frame | Nreads | Zeropoints | Mag plots | Spatial mag deviation | Spatial sky 16325A emission deviations (filled: sky, open: star) | Spatial sky continuum emission | Spatial sky telluric CO2 absorption deviations (filled: H < 10) | |||||||||||||||||||||||
| 0 | 0 |
|
|
|
|
|
|
| IPAIR | NAME | SHIFT | NEWSHIFT | S/N | NAME | SHIFT | NEWSHIFT | S/N |
| 0 | 10820093 | 0.488878 | 0.00000 | 235.752 | 10820087 | 0.00000 | 0.488878 | 224.275 |
| 1 | 10820092 | 0.488454 | 0.000423998 | 241.530 | 10820091 | -0.000958822 | 0.489837 | 238.361 |
| 2 | 10820089 | 0.488093 | 0.000785023 | 237.796 | 10820090 | -0.000697725 | 0.489576 | 233.831 |
| 3 | 10820088 | 0.487363 | 0.00151500 | 230.580 | 10820094 | -0.00231454 | 0.491193 | 203.784 |
| 4 | 10820096 | 0.488038 | 0.000840008 | 191.837 | 10820095 | -0.00209304 | 0.490971 | 171.112 |