| Red | Green | Blue | |
| z | 17.67 | ||
| znorm | Inf | ||
| sky | -Inf | -Inf | -Inf |
| S/N | 23.1 | 42.3 | 44.0 |
| S/N(c) | 0.0 | 0.0 | 0.0 |
| SN(E/C) |
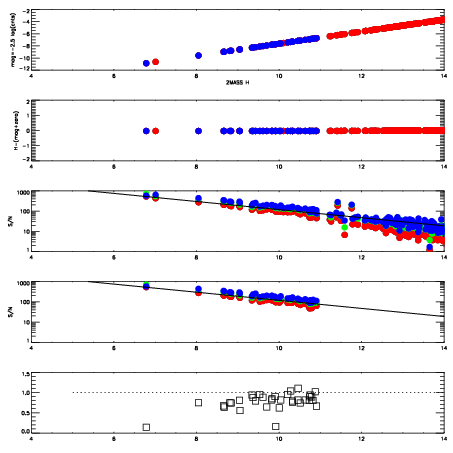
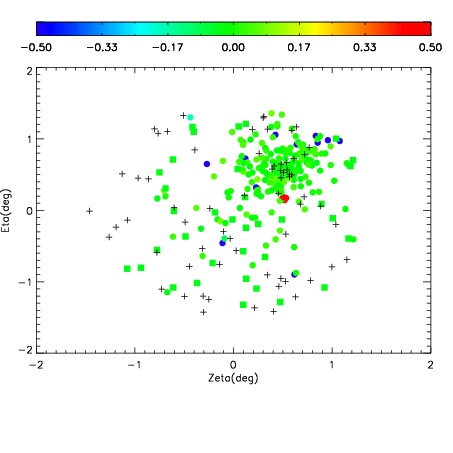
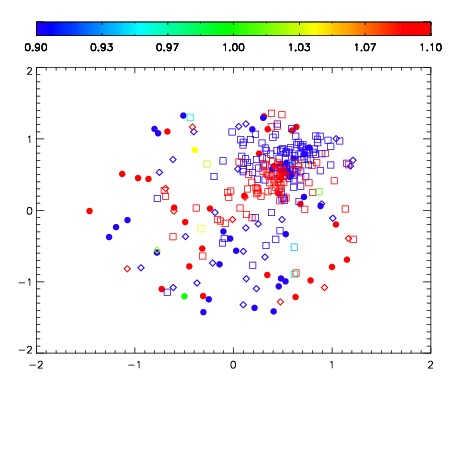
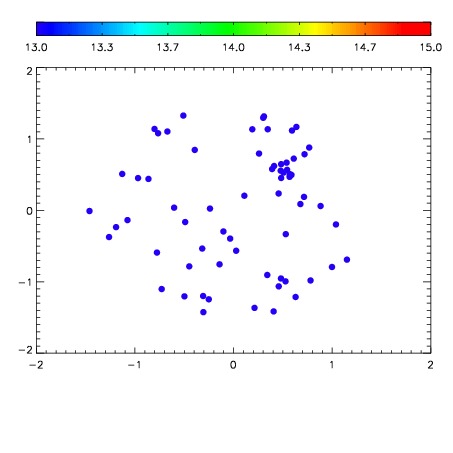

| Frame | Nreads | Zeropoints | Mag plots | Spatial mag deviation | Spatial sky 16325A emission deviations (filled: sky, open: star) | Spatial sky continuum emission | Spatial sky telluric CO2 absorption deviations (filled: H < 10) | |||||||||||||||||||||||
| 0 | 0 |
|
|
|
|
|
|
| IPAIR | NAME | SHIFT | NEWSHIFT | S/N | NAME | SHIFT | NEWSHIFT | S/N |
| 0 | 03340038 | 0.508981 | 0.00000 | 201.480 | 03340036 | 0.00000 | 0.508981 | 201.482 |
| 1 | 03340041 | 0.505432 | 0.00354898 | 201.267 | 03340039 | 0.00250702 | 0.506474 | 200.679 |
| 2 | 03340037 | 0.507976 | 0.00100499 | 200.862 | 03340040 | 0.00215771 | 0.506823 | 200.547 |
| 3 | 03340042 | 0.506692 | 0.00228900 | 196.425 | 03340043 | 0.00308445 | 0.505897 | 168.444 |