| Red | Green | Blue | |
| z | 17.67 | ||
| znorm | Inf | ||
| sky | -Inf | -Inf | -Inf |
| S/N | 31.1 | 57.1 | 59.3 |
| S/N(c) | 0.0 | 0.0 | 0.0 |
| SN(E/C) |
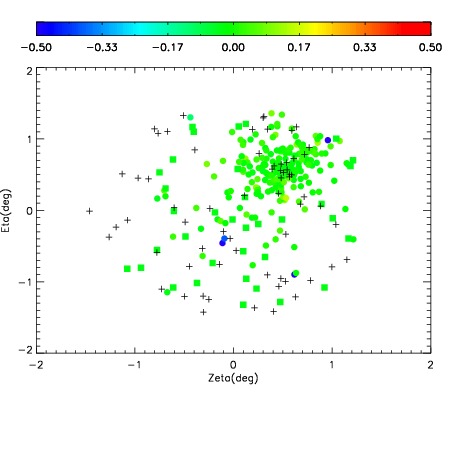
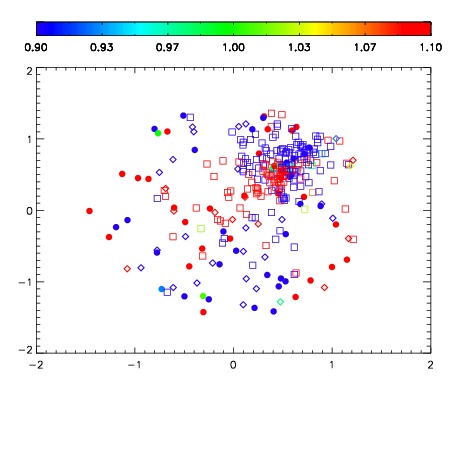


| Frame | Nreads | Zeropoints | Mag plots | Spatial mag deviation | Spatial sky 16325A emission deviations (filled: sky, open: star) | Spatial sky continuum emission | Spatial sky telluric CO2 absorption deviations (filled: H < 10) | |||||||||||||||||||||||
| 0 | 0 |
|
|
|
|
|
|
| IPAIR | NAME | SHIFT | NEWSHIFT | S/N | NAME | SHIFT | NEWSHIFT | S/N |
| 0 | 03410029 | 0.506138 | 0.00000 | 194.352 | 03410037 | 0.00140038 | 0.504738 | 191.463 |
| 1 | 03410028 | 0.500105 | 0.00603300 | 195.258 | 03410040 | 0.00257342 | 0.503565 | 193.388 |
| 2 | 03410039 | 0.501881 | 0.00425702 | 195.143 | 03410041 | 0.00244190 | 0.503696 | 193.141 |
| 3 | 03410042 | 0.499648 | 0.00649002 | 192.911 | 03410023 | 0.00000 | 0.506138 | 185.298 |
| 4 | 03410038 | 0.501301 | 0.00483704 | 189.112 | 03410044 | 0.00247396 | 0.503664 | 179.769 |
| 5 | 03410025 | 0.504351 | 0.00178701 | 187.803 | 03410030 | 0.00355370 | 0.502584 | 178.917 |
| 6 | 03410043 | 0.503349 | 0.00278902 | 185.550 | 03410026 | 0.00284759 | 0.503290 | 178.134 |
| 7 | 03410024 | 0.501883 | 0.00425506 | 179.548 | 03410027 | 0.00178793 | 0.504350 | 165.845 |