| Red | Green | Blue | |
| z | 17.67 | ||
| znorm | Inf | ||
| sky | -Inf | -Inf | -Inf |
| S/N | 20.7 | 38.5 | 39.9 |
| S/N(c) | 0.0 | 0.0 | 0.0 |
| SN(E/C) |
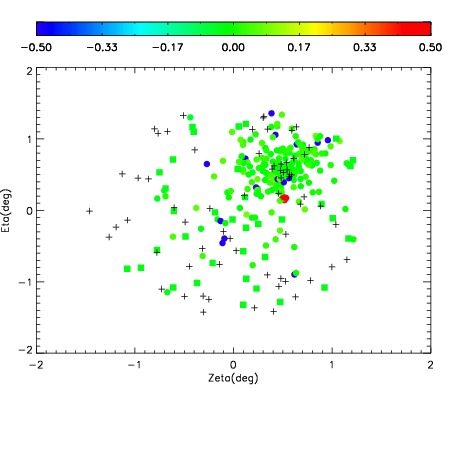
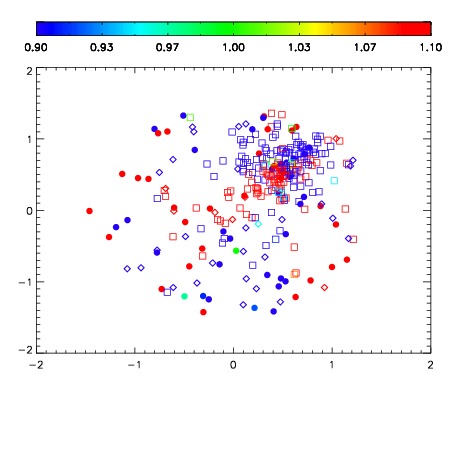
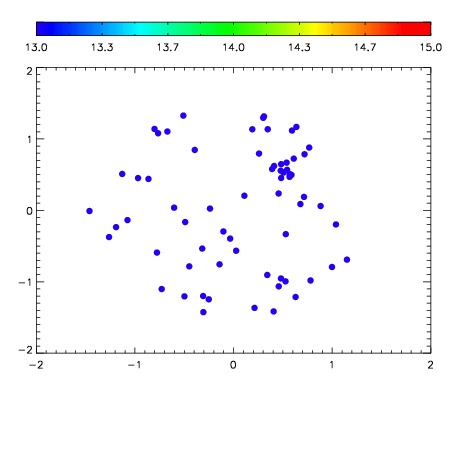

| Frame | Nreads | Zeropoints | Mag plots | Spatial mag deviation | Spatial sky 16325A emission deviations (filled: sky, open: star) | Spatial sky continuum emission | Spatial sky telluric CO2 absorption deviations (filled: H < 10) | |||||||||||||||||||||||
| 0 | 0 |
|
|
|
|
|
|
| IPAIR | NAME | SHIFT | NEWSHIFT | S/N | NAME | SHIFT | NEWSHIFT | S/N |
| 0 | 03420016 | 0.499468 | 0.00000 | 169.002 | 03420017 | 0.00165892 | 0.497809 | 172.787 |
| 1 | 03420011 | 0.494236 | 0.00523201 | 198.217 | 03420013 | 0.000760028 | 0.498708 | 188.169 |
| 2 | 03420015 | 0.494776 | 0.00469199 | 190.735 | 03420014 | 0.000152492 | 0.499316 | 185.041 |
| 3 | 03420012 | 0.497353 | 0.00211501 | 179.169 | 03420010 | 0.00000 | 0.499468 | 179.700 |