| Red | Green | Blue | |
| z | 17.76 | ||
| znorm | Inf | ||
| sky | -Inf | -Inf | -Inf |
| S/N | 35.1 | 61.9 | 62.3 |
| S/N(c) | 0.0 | 0.0 | 0.0 |
| SN(E/C) |

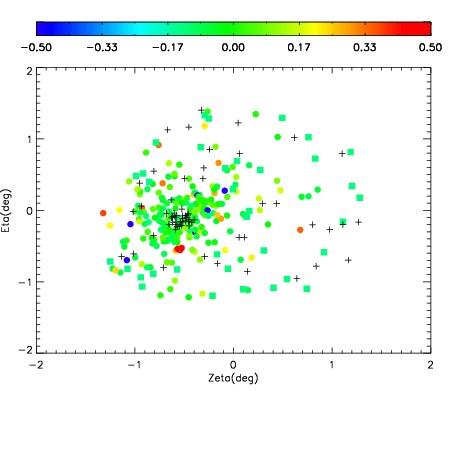
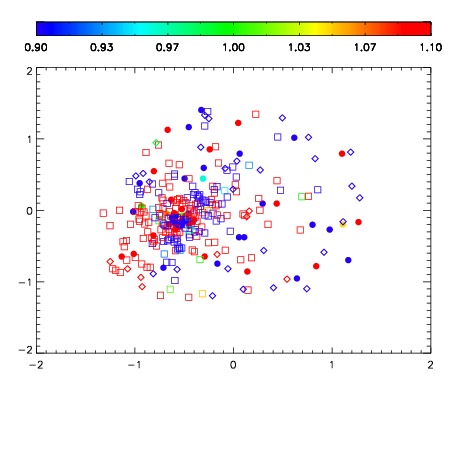
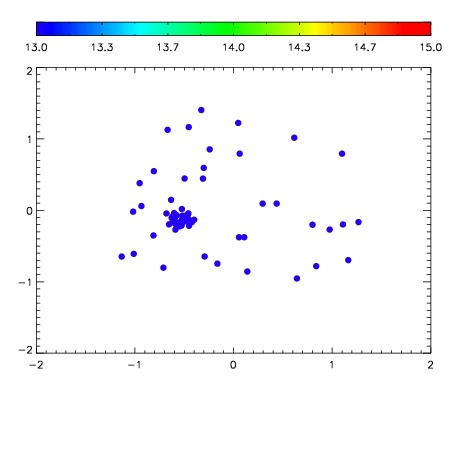

| Frame | Nreads | Zeropoints | Mag plots | Spatial mag deviation | Spatial sky 16325A emission deviations (filled: sky, open: star) | Spatial sky continuum emission | Spatial sky telluric CO2 absorption deviations (filled: H < 10) | |||||||||||||||||||||||
| 0 | 0 |
|
|
|
|
|
|
| IPAIR | NAME | SHIFT | NEWSHIFT | S/N | NAME | SHIFT | NEWSHIFT | S/N |
| 0 | 03060050 | 0.495791 | 0.00000 | 176.880 | 03060051 | 0.00122806 | 0.494563 | 176.675 |
| 1 | 03060037 | 0.495262 | 0.000528991 | 188.831 | 03060036 | 0.00000 | 0.495791 | 189.043 |
| 2 | 03060045 | 0.493354 | 0.00243700 | 185.846 | 03060044 | -0.00162138 | 0.497412 | 187.149 |
| 3 | 03060041 | 0.493082 | 0.00270900 | 184.841 | 03060048 | -0.000261775 | 0.496053 | 185.028 |
| 4 | 03060042 | 0.493900 | 0.00189099 | 184.356 | 03060047 | -0.000284789 | 0.496076 | 184.477 |
| 5 | 03060049 | 0.494846 | 0.000945002 | 183.789 | 03060043 | -0.00122065 | 0.497012 | 183.793 |
| 6 | 03060046 | 0.494521 | 0.00127000 | 182.981 | 03060040 | -0.00441454 | 0.500206 | 180.151 |
| 7 | 03060038 | 0.495597 | 0.000193983 | 178.720 | 03060039 | -0.00319785 | 0.498989 | 178.547 |