| Red | Green | Blue | |
| z | 17.76 | ||
| znorm | Inf | ||
| sky | -Inf | -Inf | -Inf |
| S/N | 24.6 | 43.8 | 45.6 |
| S/N(c) | 0.0 | 0.0 | 0.0 |
| SN(E/C) |
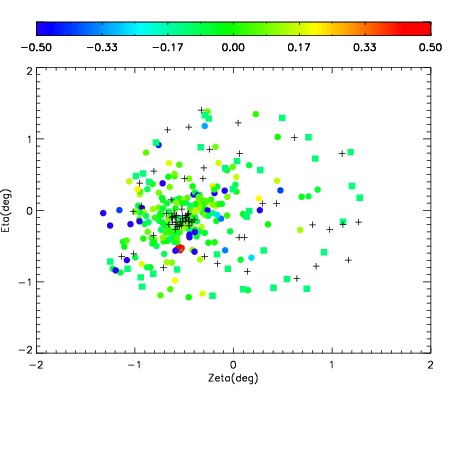
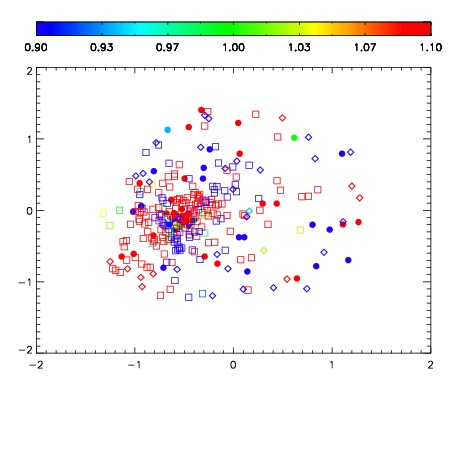
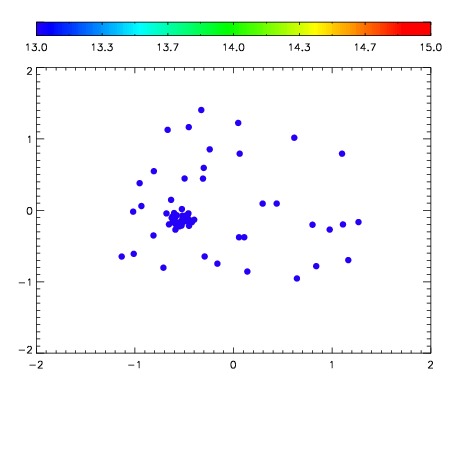

| Frame | Nreads | Zeropoints | Mag plots | Spatial mag deviation | Spatial sky 16325A emission deviations (filled: sky, open: star) | Spatial sky continuum emission | Spatial sky telluric CO2 absorption deviations (filled: H < 10) | |||||||||||||||||||||||
| 0 | 0 |
|
|
|
|
|
|
| IPAIR | NAME | SHIFT | NEWSHIFT | S/N | NAME | SHIFT | NEWSHIFT | S/N |
| 0 | 03190029 | 0.503091 | 0.00000 | 192.293 | 03190027 | 0.00279711 | 0.500294 | 191.119 |
| 1 | 03190025 | 0.499833 | 0.00325799 | 194.095 | 03190030 | 0.00293089 | 0.500160 | 195.331 |
| 2 | 03190024 | 0.497724 | 0.00536698 | 193.824 | 03190026 | 0.00151061 | 0.501580 | 193.588 |
| 3 | 03190028 | 0.499833 | 0.00325799 | 189.221 | 03190023 | 0.00000 | 0.503091 | 190.421 |