| Red | Green | Blue | |
| z | 17.74 | ||
| znorm | Inf | ||
| sky | -Inf | -Inf | -Inf |
| S/N | 23.4 | 42.6 | 44.5 |
| S/N(c) | 0.0 | 0.0 | 0.0 |
| SN(E/C) |
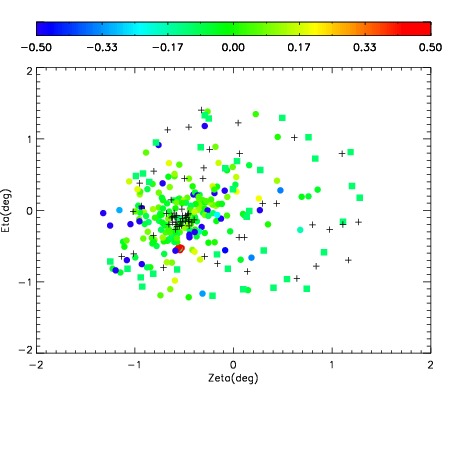
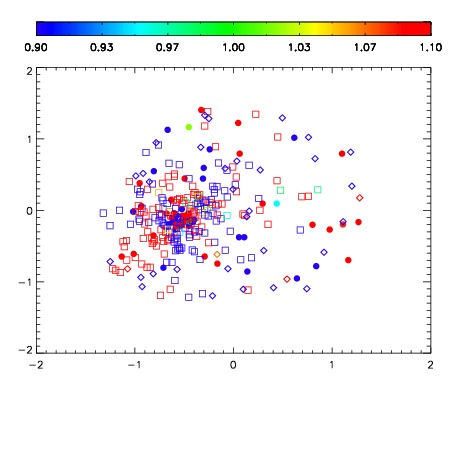
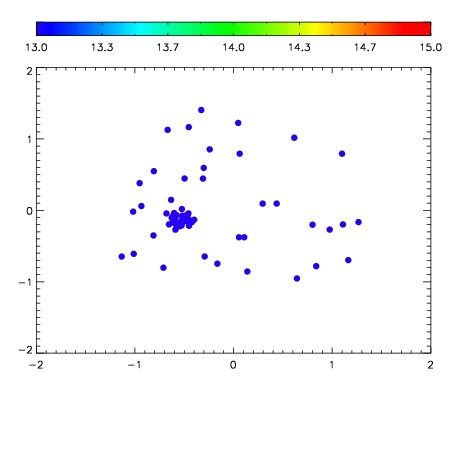

| Frame | Nreads | Zeropoints | Mag plots | Spatial mag deviation | Spatial sky 16325A emission deviations (filled: sky, open: star) | Spatial sky continuum emission | Spatial sky telluric CO2 absorption deviations (filled: H < 10) | |||||||||||||||||||||||
| 0 | 0 |
|
|
|
|
|
|
| IPAIR | NAME | SHIFT | NEWSHIFT | S/N | NAME | SHIFT | NEWSHIFT | S/N |
| 0 | 03200016 | 0.517223 | 0.00000 | 192.964 | 03200017 | 0.00218088 | 0.515042 | 192.231 |
| 1 | 03200015 | 0.507858 | 0.00936502 | 192.838 | 03200013 | 0.00157512 | 0.515648 | 190.042 |
| 2 | 03200011 | 0.508065 | 0.00915802 | 188.034 | 03200014 | 0.00195512 | 0.515268 | 187.116 |
| 3 | 03200012 | 0.507942 | 0.00928098 | 181.474 | 03200010 | 0.00000 | 0.517223 | 168.720 |