| Red | Green | Blue | |
| z | 17.75 | ||
| znorm | Inf | ||
| sky | -Inf | -Inf | -Inf |
| S/N | 28.6 | 51.5 | 53.7 |
| S/N(c) | 0.0 | 0.0 | 0.0 |
| SN(E/C) |
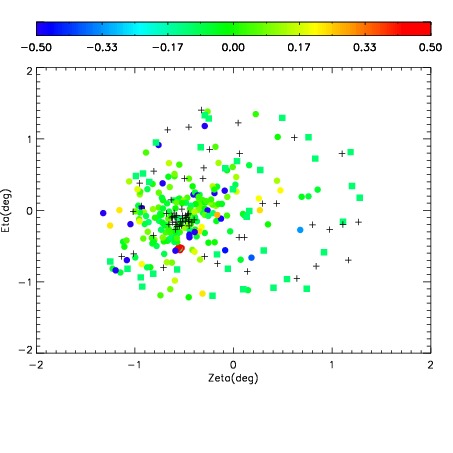
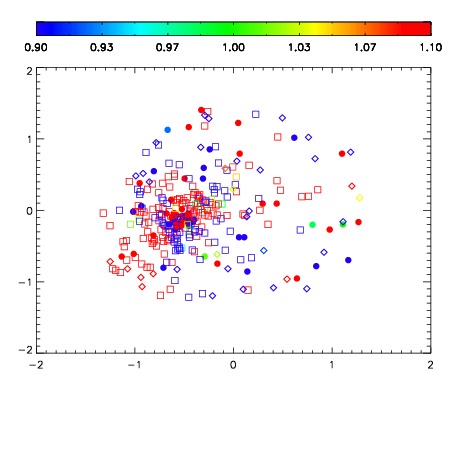
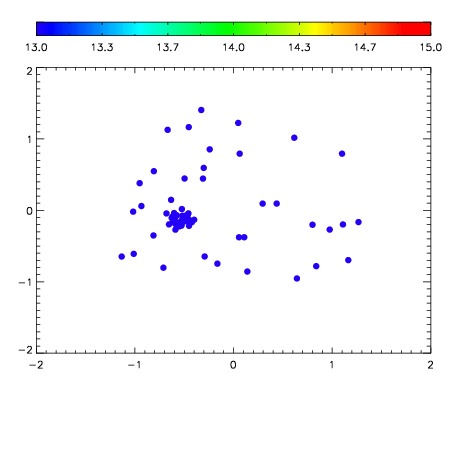

| Frame | Nreads | Zeropoints | Mag plots | Spatial mag deviation | Spatial sky 16325A emission deviations (filled: sky, open: star) | Spatial sky continuum emission | Spatial sky telluric CO2 absorption deviations (filled: H < 10) | |||||||||||||||||||||||
| 0 | 0 |
|
|
|
|
|
|
| IPAIR | NAME | SHIFT | NEWSHIFT | S/N | NAME | SHIFT | NEWSHIFT | S/N |
| 0 | 03210012 | 0.514905 | 0.00000 | 195.604 | 03210014 | 0.00122863 | 0.513676 | 195.107 |
| 1 | 03210015 | 0.504837 | 0.0100680 | 194.752 | 03210013 | 0.000362884 | 0.514542 | 194.372 |
| 2 | 03210011 | 0.507699 | 0.00720596 | 194.545 | 03210017 | 0.00192832 | 0.512977 | 192.724 |
| 3 | 03210016 | 0.505631 | 0.00927395 | 194.227 | 03210010 | 0.00000 | 0.514905 | 188.830 |
| 4 | 03210020 | 0.514822 | 8.29697e-05 | 187.894 | 03210021 | 0.00123356 | 0.513671 | 187.026 |
| 5 | 03210019 | 0.507953 | 0.00695199 | 162.666 | 03210018 | 0.000741352 | 0.514164 | 166.573 |