| Red | Green | Blue | |
| z | 17.64 | ||
| znorm | Inf | ||
| sky | -NaN | -Inf | -Inf |
| S/N | 26.0 | 42.3 | 47.9 |
| S/N(c) | 0.0 | 0.0 | 0.0 |
| SN(E/C) |
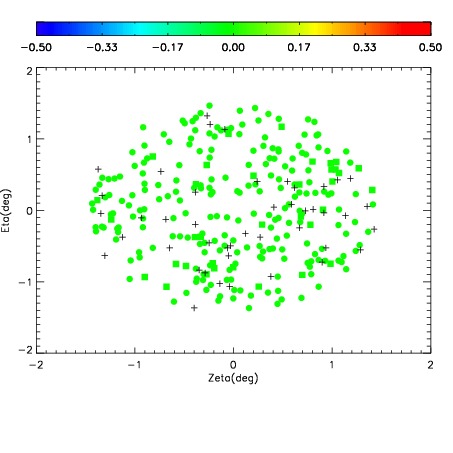
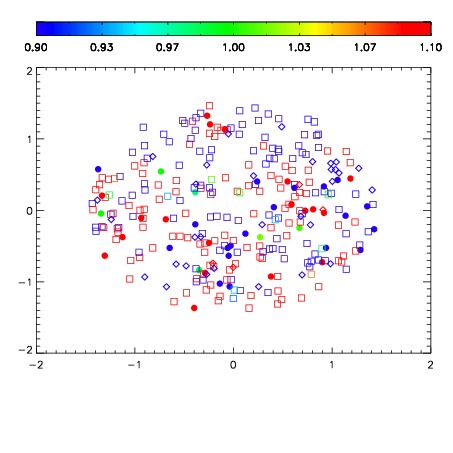
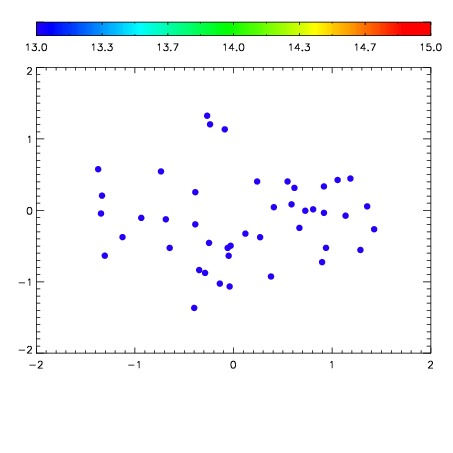

| Frame | Nreads | Zeropoints | Mag plots | Spatial mag deviation | Spatial sky 16325A emission deviations (filled: sky, open: star) | Spatial sky continuum emission | Spatial sky telluric CO2 absorption deviations (filled: H < 10) | |||||||||||||||||||||||
| 0 | 0 |
|
|
|
|
|
|
| IPAIR | NAME | SHIFT | NEWSHIFT | S/N | NAME | SHIFT | NEWSHIFT | S/N |
| 0 | 03130046 | 0.514513 | 0.00000 | 228.177 | 03130043 | 0.00586408 | 0.508649 | 233.355 |
| 1 | 03130041 | 0.505110 | 0.00940299 | 237.957 | 03130040 | 0.00000 | 0.514513 | 236.970 |
| 2 | 03130045 | 0.507176 | 0.00733703 | 226.769 | 03130044 | 0.00572271 | 0.508790 | 233.255 |