| Red | Green | Blue | |
| z | 17.64 | ||
| znorm | Inf | ||
| sky | -NaN | -Inf | -Inf |
| S/N | 29.6 | 50.9 | 56.5 |
| S/N(c) | 0.0 | 0.0 | 0.0 |
| SN(E/C) |
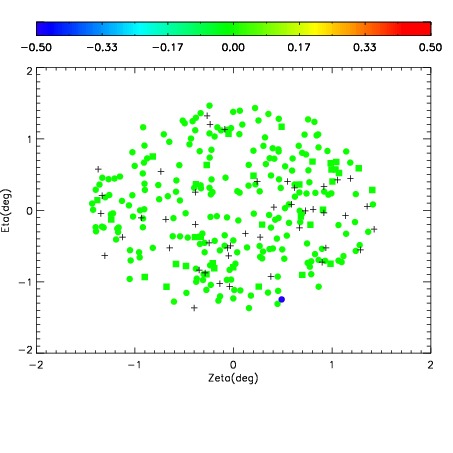
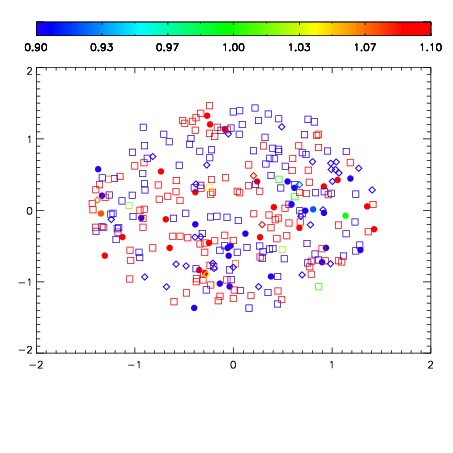
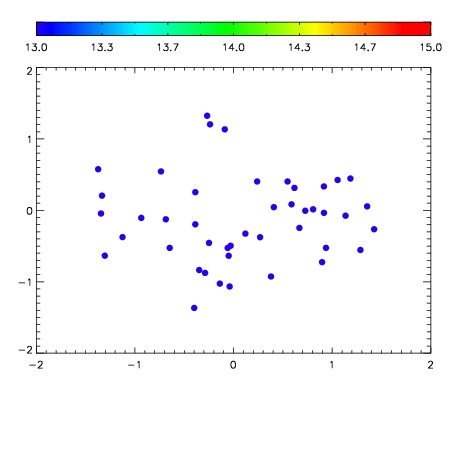

| Frame | Nreads | Zeropoints | Mag plots | Spatial mag deviation | Spatial sky 16325A emission deviations (filled: sky, open: star) | Spatial sky continuum emission | Spatial sky telluric CO2 absorption deviations (filled: H < 10) | |||||||||||||||||||||||
| 0 | 0 |
|
|
|
|
|
|
| IPAIR | NAME | SHIFT | NEWSHIFT | S/N | NAME | SHIFT | NEWSHIFT | S/N |
| 0 | 03410087 | 0.499556 | 0.00000 | 219.607 | 03410088 | -0.000424265 | 0.499980 | 219.200 |
| 1 | 03410086 | 0.498645 | 0.000910997 | 221.592 | 03410085 | -0.00159702 | 0.501153 | 223.919 |
| 2 | 03410083 | 0.491735 | 0.00782099 | 220.595 | 03410084 | -0.000994643 | 0.500551 | 223.314 |
| 3 | 03410082 | 0.490551 | 0.00900501 | 217.539 | 03410081 | 0.00000 | 0.499556 | 217.583 |