| Red | Green | Blue | |
| z | 17.66 | ||
| znorm | Inf | ||
| sky | -Inf | -Inf | -Inf |
| S/N | 4.8 | 10.3 | 10.4 |
| S/N(c) | 0.0 | 0.0 | 0.0 |
| SN(E/C) |
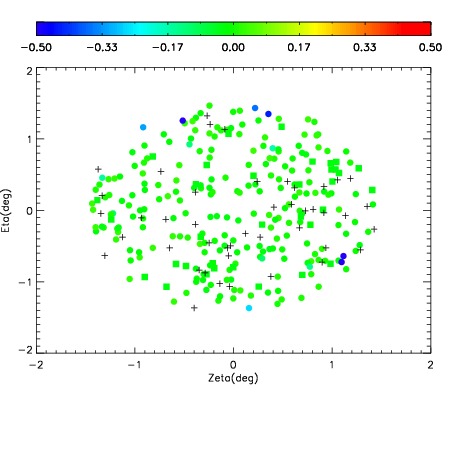
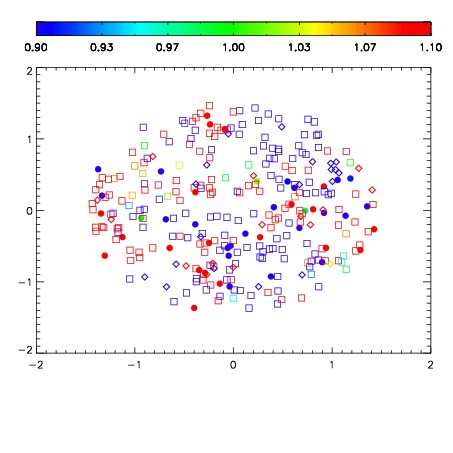
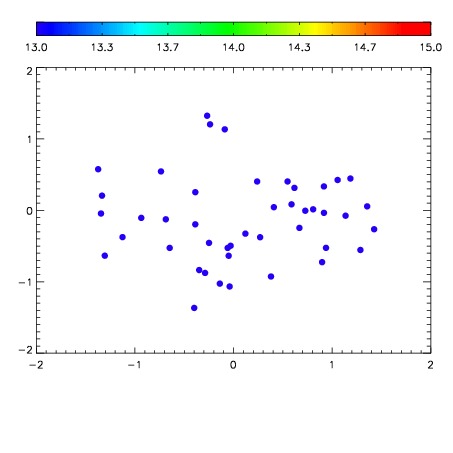

| Frame | Nreads | Zeropoints | Mag plots | Spatial mag deviation | Spatial sky 16325A emission deviations (filled: sky, open: star) | Spatial sky continuum emission | Spatial sky telluric CO2 absorption deviations (filled: H < 10) | |||||||||||||||||||||||
| 0 | 0 |
|
|
|
|
|
|
| IPAIR | NAME | SHIFT | NEWSHIFT | S/N | NAME | SHIFT | NEWSHIFT | S/N |
| 0 | 03500030 | 0.512642 | 0.00000 | 92.8878 | 03500027 | 0.00248189 | 0.510160 | 88.8594 |
| 1 | 03500029 | 0.508604 | 0.00403804 | 56.9813 | 03500028 | 0.00231679 | 0.510325 | 80.1533 |
| 2 | 03500026 | 0.507851 | 0.00479102 | 31.3725 | 03500024 | 0.00000 | 0.512642 | 72.8980 |
| 3 | 03500025 | 0.506681 | 0.00596100 | 26.4834 | 03500031 | 0.00328706 | 0.509355 | 69.6987 |