| Red | Green | Blue | |
| z | 17.64 | ||
| znorm | Inf | ||
| sky | -Inf | -Inf | -Inf |
| S/N | 33.4 | 58.2 | 61.2 |
| S/N(c) | 0.0 | 0.0 | 0.0 |
| SN(E/C) |

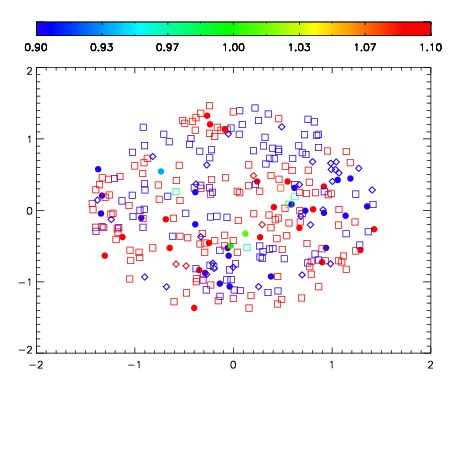
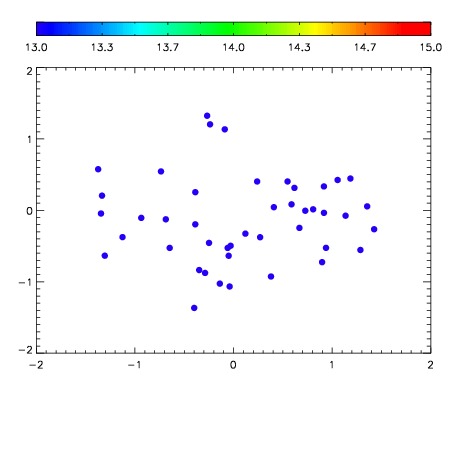

| Frame | Nreads | Zeropoints | Mag plots | Spatial mag deviation | Spatial sky 16325A emission deviations (filled: sky, open: star) | Spatial sky continuum emission | Spatial sky telluric CO2 absorption deviations (filled: H < 10) | |||||||||||||||||||||||
| 0 | 0 |
|
|
|
|
|
|
| IPAIR | NAME | SHIFT | NEWSHIFT | S/N | NAME | SHIFT | NEWSHIFT | S/N |
| 0 | 03670076 | 0.508071 | 0.00000 | 230.548 | 03670070 | 0.00000 | 0.508071 | 231.120 |
| 1 | 03670072 | 0.497258 | 0.0108130 | 231.828 | 03670074 | 0.00255422 | 0.505517 | 232.115 |
| 2 | 03670071 | 0.495739 | 0.0123320 | 231.463 | 03670073 | 0.00337481 | 0.504696 | 232.106 |
| 3 | 03670075 | 0.505946 | 0.00212502 | 230.560 | 03670077 | 0.00321889 | 0.504852 | 231.943 |