| Red | Green | Blue | |
| z | 17.64 | ||
| znorm | Inf | ||
| sky | -Inf | -Inf | -Inf |
| S/N | 28.7 | 48.8 | 53.8 |
| S/N(c) | 0.0 | 0.0 | 0.0 |
| SN(E/C) |

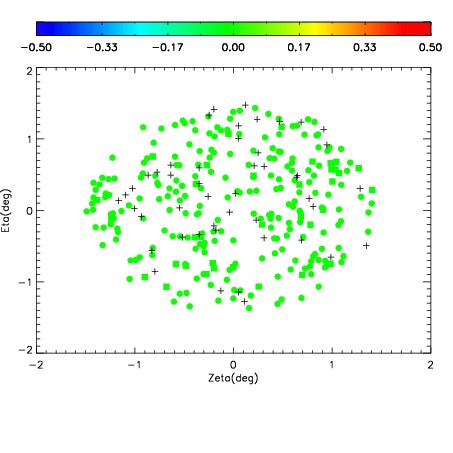
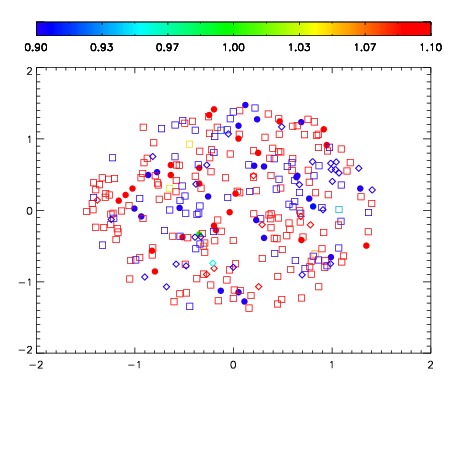
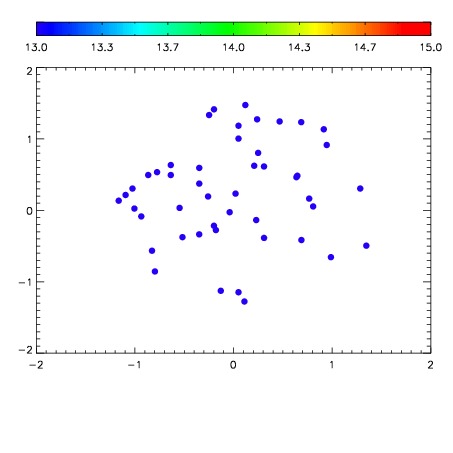

| Frame | Nreads | Zeropoints | Mag plots | Spatial mag deviation | Spatial sky 16325A emission deviations (filled: sky, open: star) | Spatial sky continuum emission | Spatial sky telluric CO2 absorption deviations (filled: H < 10) | |||||||||||||||||||||||
| 0 | 0 |
|
|
|
|
|
|
| IPAIR | NAME | SHIFT | NEWSHIFT | S/N | NAME | SHIFT | NEWSHIFT | S/N |
| 0 | 03200060 | 0.515568 | 0.00000 | 216.203 | 03200065 | -0.00157690 | 0.517145 | 215.908 |
| 1 | 03200059 | 0.509132 | 0.00643599 | 216.955 | 03200061 | -0.00132897 | 0.516897 | 217.068 |
| 2 | 03200064 | 0.513665 | 0.00190300 | 216.355 | 03200062 | -0.00244191 | 0.518010 | 216.625 |
| 3 | 03200063 | 0.504729 | 0.0108390 | 215.650 | 03200058 | 0.00000 | 0.515568 | 214.349 |