| Red | Green | Blue | |
| z | 17.64 | ||
| znorm | Inf | ||
| sky | -NaN | -Inf | -Inf |
| S/N | 21.1 | 38.1 | 44.6 |
| S/N(c) | 0.0 | 0.0 | 0.0 |
| SN(E/C) |
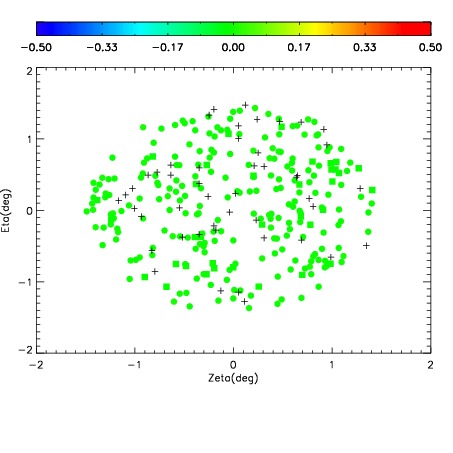
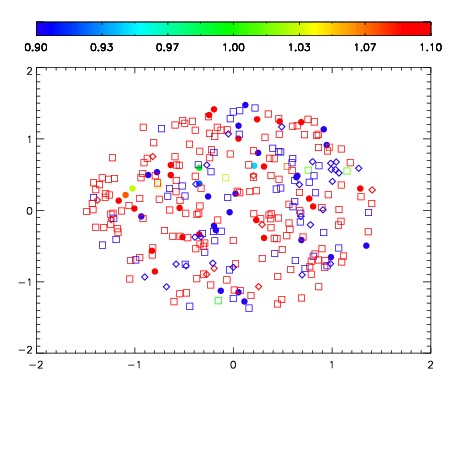
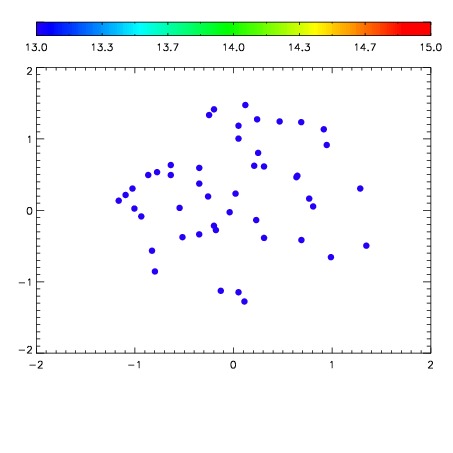

| Frame | Nreads | Zeropoints | Mag plots | Spatial mag deviation | Spatial sky 16325A emission deviations (filled: sky, open: star) | Spatial sky continuum emission | Spatial sky telluric CO2 absorption deviations (filled: H < 10) | |||||||||||||||||||||||
| 0 | 0 |
|
|
|
|
|
|
| IPAIR | NAME | SHIFT | NEWSHIFT | S/N | NAME | SHIFT | NEWSHIFT | S/N |
| 0 | 03750071 | 0.508209 | 0.00000 | 201.155 | 03750066 | 0.00000 | 0.508209 | 190.052 |
| 1 | 03750067 | 0.504335 | 0.00387400 | 205.782 | 03750073 | 0.00367178 | 0.504537 | 203.958 |
| 2 | 03750072 | 0.508158 | 5.09620e-05 | 204.795 | 03750069 | 0.00222127 | 0.505988 | 191.300 |
| 3 | 03750068 | 0.505432 | 0.00277698 | 200.899 | 03750070 | 0.00324301 | 0.504966 | 188.470 |