| Red | Green | Blue | |
| z | 17.64 | ||
| znorm | Inf | ||
| sky | -Inf | -NaN | -Inf |
| S/N | 22.8 | 42.5 | 45.8 |
| S/N(c) | 0.0 | 0.0 | 0.0 |
| SN(E/C) |
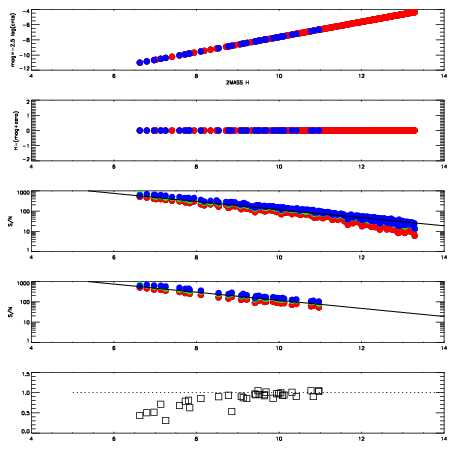
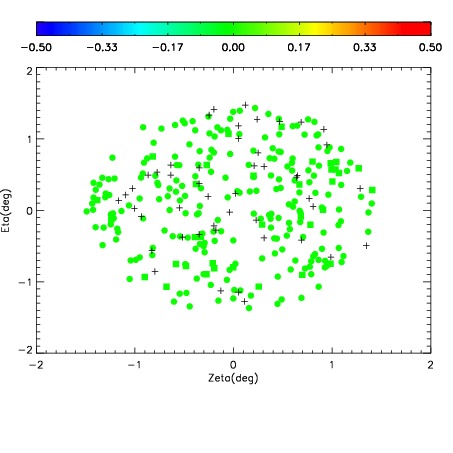
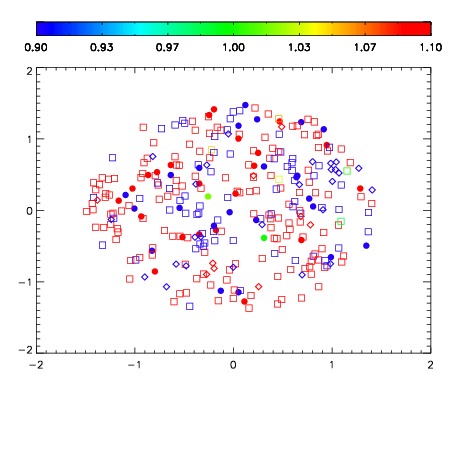
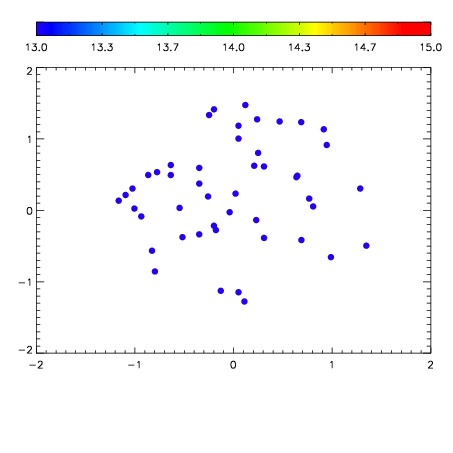

| Frame | Nreads | Zeropoints | Mag plots | Spatial mag deviation | Spatial sky 16325A emission deviations (filled: sky, open: star) | Spatial sky continuum emission | Spatial sky telluric CO2 absorption deviations (filled: H < 10) | |||||||||||||||||||||||
| 0 | 0 |
|
|
|
|
|
|
| IPAIR | NAME | SHIFT | NEWSHIFT | S/N | NAME | SHIFT | NEWSHIFT | S/N |
| 0 | 03780031 | 0.505750 | 0.00000 | 203.622 | 03780032 | 0.00189197 | 0.503858 | 200.271 |
| 1 | 03780027 | 0.504458 | 0.00129199 | 205.018 | 03780028 | 0.00129992 | 0.504450 | 201.040 |
| 2 | 03780026 | 0.504603 | 0.00114697 | 202.256 | 03780025 | 0.00000 | 0.505750 | 198.496 |
| 3 | 03780030 | 0.504051 | 0.00169897 | 201.670 | 03780029 | 0.00222638 | 0.503524 | 185.218 |