| Red | Green | Blue | |
| z | 17.64 | ||
| znorm | Inf | ||
| sky | -Inf | -Inf | -Inf |
| S/N | 21.3 | 37.7 | 39.8 |
| S/N(c) | 0.0 | 0.0 | 0.0 |
| SN(E/C) |
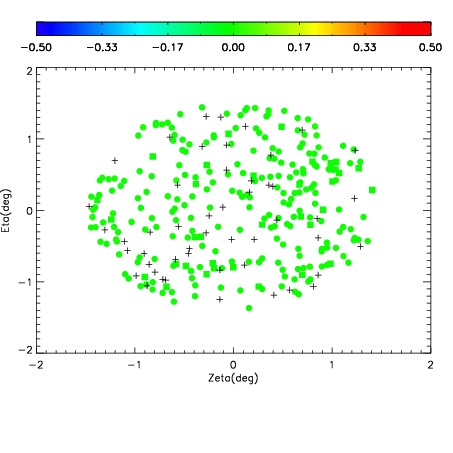
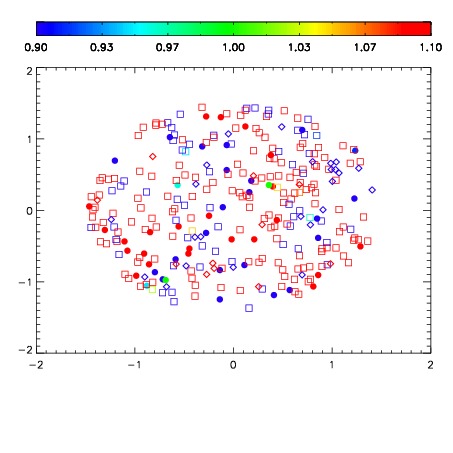
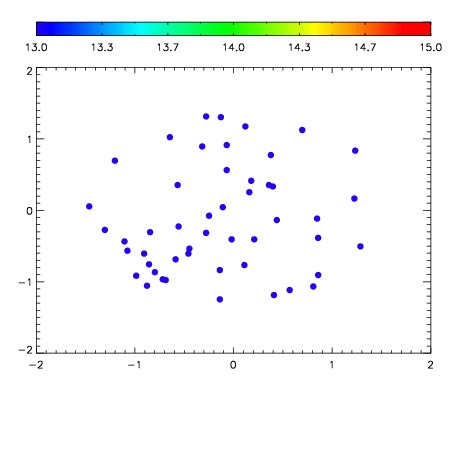

| Frame | Nreads | Zeropoints | Mag plots | Spatial mag deviation | Spatial sky 16325A emission deviations (filled: sky, open: star) | Spatial sky continuum emission | Spatial sky telluric CO2 absorption deviations (filled: H < 10) | |||||||||||||||||||||||
| 0 | 0 |
|
|
|
|
|
|
| IPAIR | NAME | SHIFT | NEWSHIFT | S/N | NAME | SHIFT | NEWSHIFT | S/N |
| 0 | 03970033 | 0.504462 | 0.00000 | 227.381 | 03970027 | 0.00000 | 0.504462 | 220.238 |
| 1 | 03970028 | 0.501669 | 0.00279301 | 223.110 | 03970031 | 0.000717063 | 0.503745 | 201.422 |
| 2 | 03970029 | 0.503041 | 0.00142097 | 213.252 | 03970034 | 0.00209645 | 0.502366 | 176.247 |
| 3 | 03970032 | 0.503470 | 0.000992000 | 209.807 | 03970030 | 0.00234760 | 0.502114 | 151.859 |