| Red | Green | Blue | |
| z | 17.64 | ||
| znorm | Inf | ||
| sky | -NaN | -Inf | -Inf |
| S/N | 30.7 | 53.1 | 56.8 |
| S/N(c) | 0.0 | 0.0 | 0.0 |
| SN(E/C) |
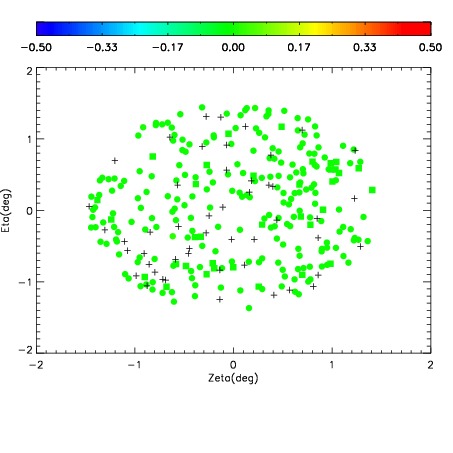
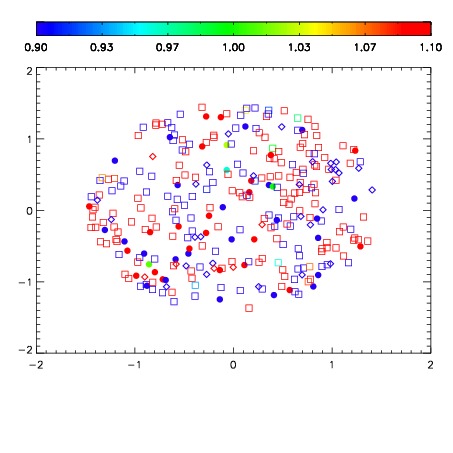
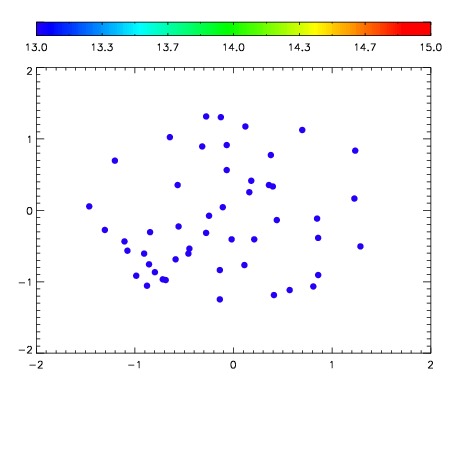

| Frame | Nreads | Zeropoints | Mag plots | Spatial mag deviation | Spatial sky 16325A emission deviations (filled: sky, open: star) | Spatial sky continuum emission | Spatial sky telluric CO2 absorption deviations (filled: H < 10) | |||||||||||||||||||||||
| 0 | 0 |
|
|
|
|
|
|
| IPAIR | NAME | SHIFT | NEWSHIFT | S/N | NAME | SHIFT | NEWSHIFT | S/N |
| 0 | 11130049 | 0.485660 | 0.00000 | 222.771 | 11130051 | 0.00219804 | 0.483462 | 219.225 |
| 1 | 11130046 | 0.485546 | 0.000113994 | 223.334 | 11130048 | -0.000774922 | 0.486435 | 225.522 |
| 2 | 11130050 | 0.485012 | 0.000647992 | 222.911 | 11130047 | -0.00125263 | 0.486913 | 223.909 |
| 3 | 11130045 | 0.484792 | 0.000867993 | 212.908 | 11130044 | 0.00000 | 0.485660 | 217.293 |