| Red | Green | Blue | |
| z | 17.64 | ||
| znorm | Inf | ||
| sky | -Inf | -Inf | -Inf |
| S/N | 28.6 | 45.4 | 53.1 |
| S/N(c) | 0.0 | 0.0 | 0.0 |
| SN(E/C) |
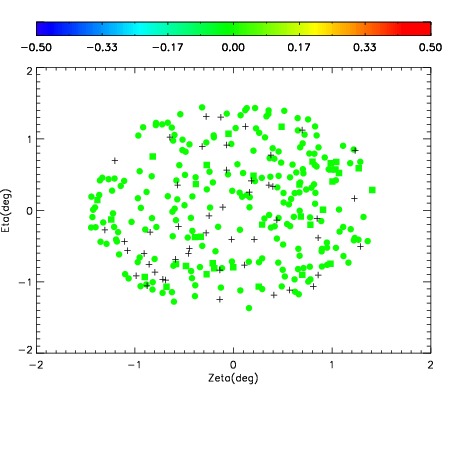
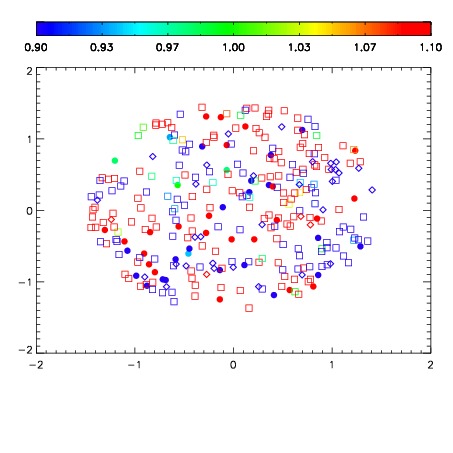
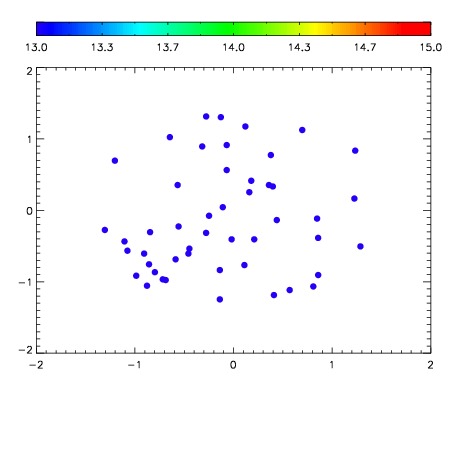

| Frame | Nreads | Zeropoints | Mag plots | Spatial mag deviation | Spatial sky 16325A emission deviations (filled: sky, open: star) | Spatial sky continuum emission | Spatial sky telluric CO2 absorption deviations (filled: H < 10) | |||||||||||||||||||||||
| 0 | 0 |
|
|
|
|
|
|
| IPAIR | NAME | SHIFT | NEWSHIFT | S/N | NAME | SHIFT | NEWSHIFT | S/N |
| 0 | 11340048 | 0.484826 | 0.00000 | 202.608 | 11340034 | 0.00000 | 0.484826 | 214.598 |
| 1 | 11340049 | 0.484609 | 0.000216991 | 202.566 | 11340037 | -0.000128091 | 0.484954 | 189.229 |
| 2 | 11340035 | 0.480579 | 0.00424701 | 190.054 | 11340038 | 0.000751389 | 0.484075 | 161.845 |
| 3 | 11340036 | 0.481710 | 0.00311601 | 187.124 | 11340047 | 0.00337181 | 0.481454 | 155.483 |
| 4 | 11340039 | 0.482063 | 0.00276300 | 143.634 | 11340050 | 0.00202180 | 0.482804 | 150.842 |
| 5 | 11340040 | 0.483908 | 0.000918001 | 127.574 | 11340041 | 0.00266010 | 0.482166 | 150.404 |