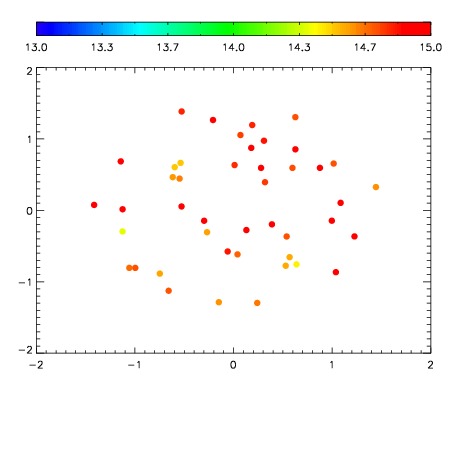
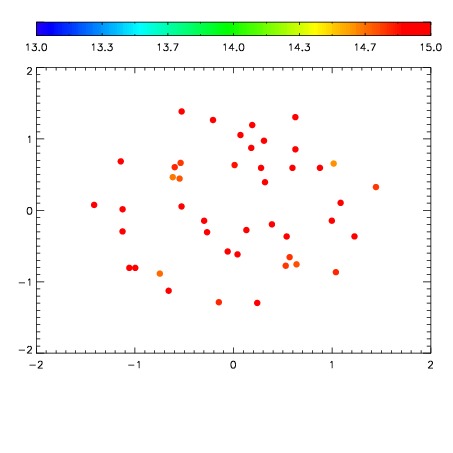
| Frame | Nreads | Zeropoints | Mag plots
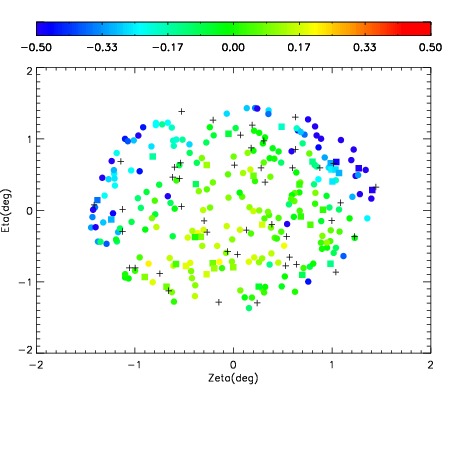
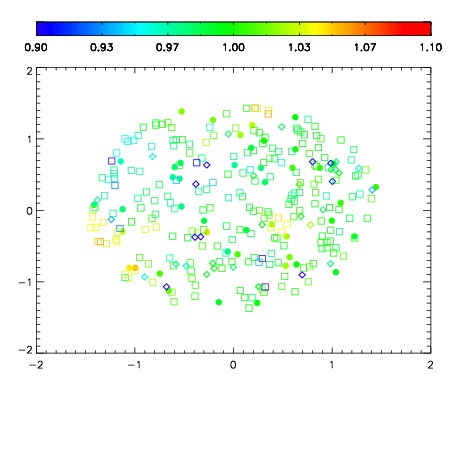
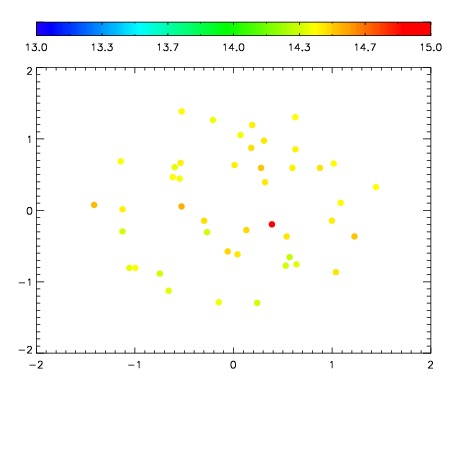
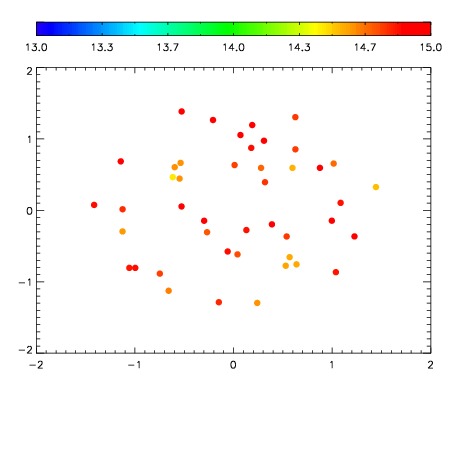
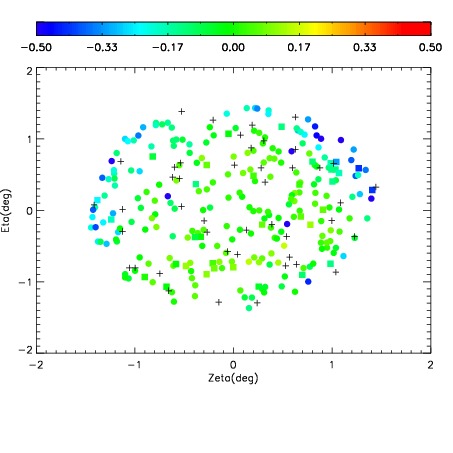
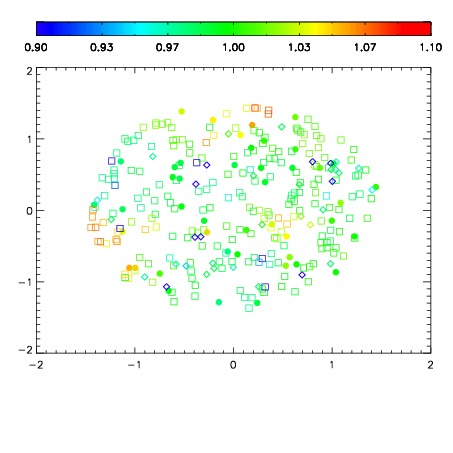
| Spatial mag deviation
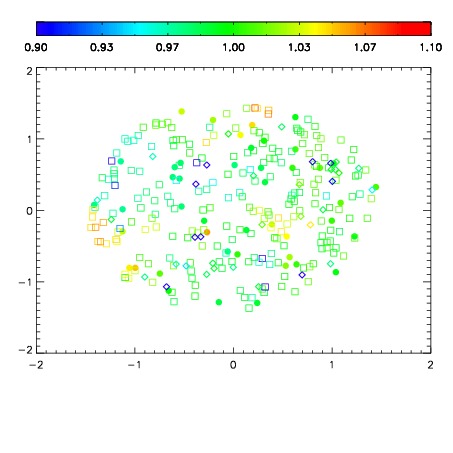
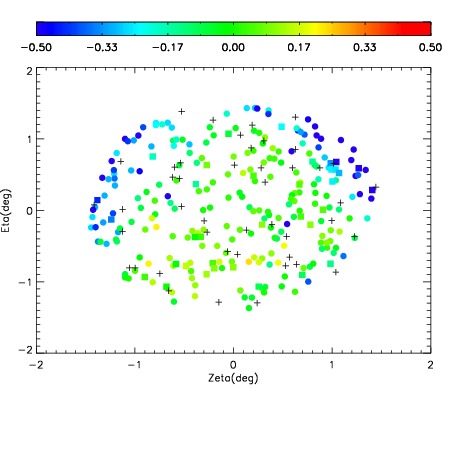
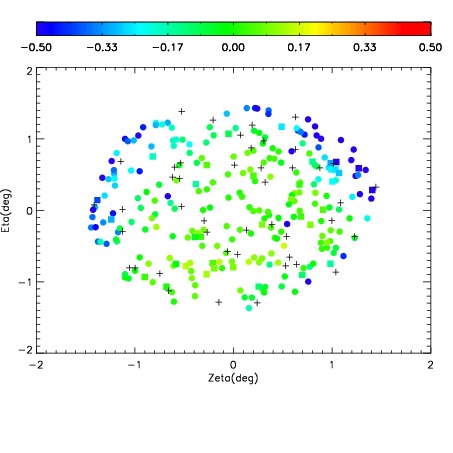
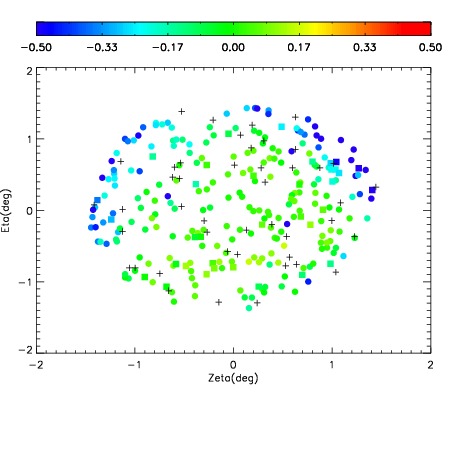
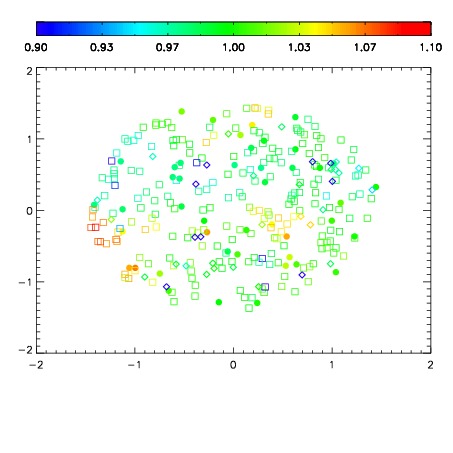
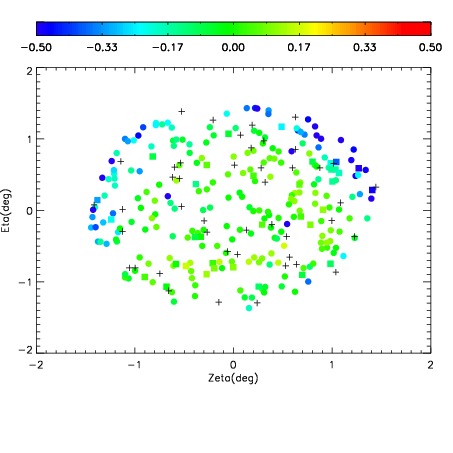
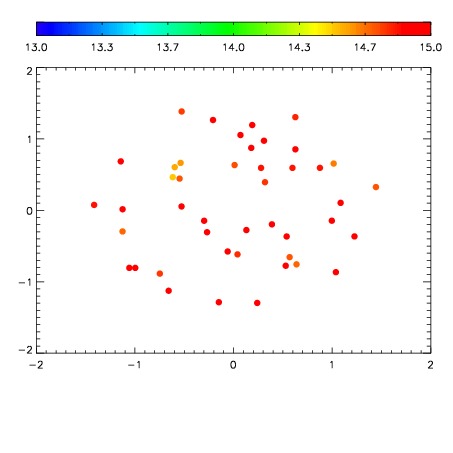
| Spatial sky 16325A emission deviations (filled: sky, open: star)
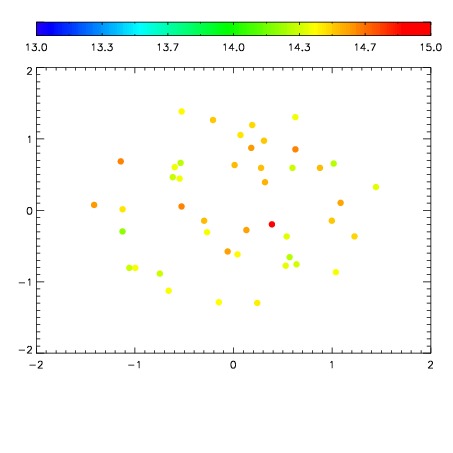
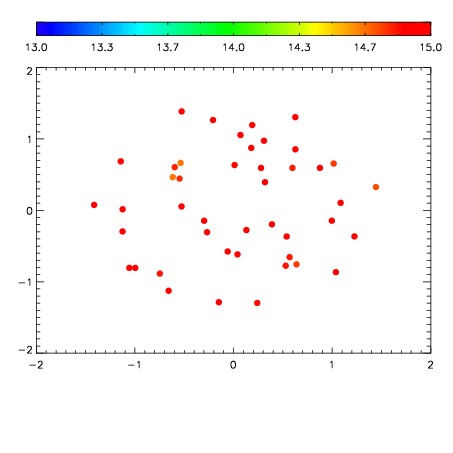
| Spatial sky continuum emission
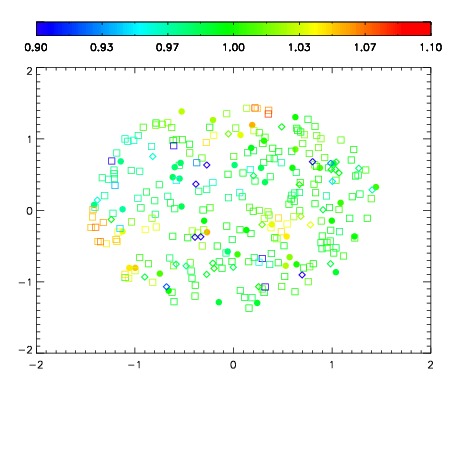
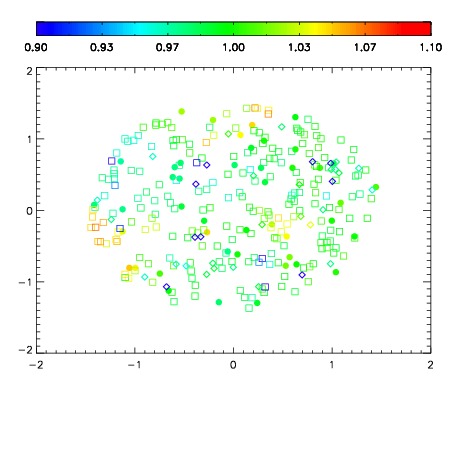
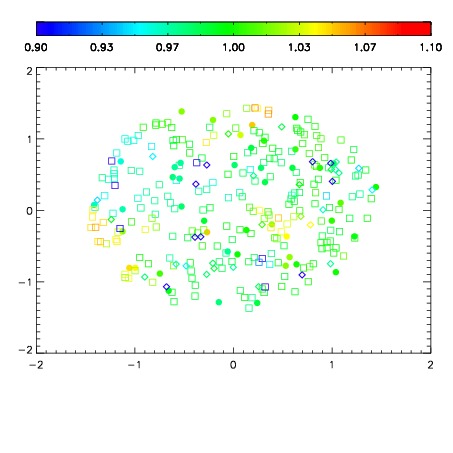
| Spatial sky telluric CO2 absorption deviations (filled: H < 10)
|
| 3100076
| 47
| | Red | Green | Blue
| | z | | 18.41
| | znorm | | 14.23
| | sky | 15.0 | 14.4 | 14.3
| | S/N | 11.4 | 17.9 | 18.5
| | S/N(c) | 9.7 | 16.6 | 17.0
| | SN(E/C) 0.94
|
| 
| 
| 
| 
| 
|
| 3100077
| 47
| | Red | Green | Blue
| | z | | 18.52
| | znorm | | 14.34
| | sky | 15.1 | 14.8 | 14.7
| | S/N | 12.2 | 18.9 | 20.1
| | S/N(c) | 10.4 | 17.8 | 18.3
| | SN(E/C) 0.95
|
| 
| 
| 
| 
| 
|
| 3100078
| 47
| | Red | Green | Blue
| | z | | 17.42
| | znorm | | 13.24
| | sky | 14.6 | 14.4 | 14.4
| | S/N | 4.6 | 9.4 | 9.5
| | S/N(c) | 4.1 | 8.4 | 8.4
| | SN(E/C) 0.94
|
| 
| 
| 
| 
| 
|
| 3100079
| 47
| | Red | Green | Blue
| | z | | 18.59
| | znorm | | 14.41
| | sky | 14.9 | 14.8 | 14.9
| | S/N | 12.4 | 19.5 | 20.8
| | S/N(c) | 10.6 | 18.4 | 19.0
| | SN(E/C) 0.92
|
| 
| 
| 
| 
| 
|
| 3100080
| 47
| | Red | Green | Blue
| | z | | 18.58
| | znorm | | 14.40
| | sky | 15.3 | 14.9 | 15.1
| | S/N | 12.0 | 19.4 | 20.5
| | S/N(c) | 10.2 | 18.2 | 18.9
| | SN(E/C) 0.97
|
| 
| 
| 
| 
| 
|
| 3100081
| 47
| | Red | Green | Blue
| | z | | 18.38
| | znorm | | 14.20
| | sky | 15.1 | 14.9 | 15.0
| | S/N | 10.5 | 17.0 | 18.2
| | S/N(c) | 8.9 | 16.0 | 16.7
| | SN(E/C) 0.97
|
| 
| 
| 
| 
| 
|
| 3100082
| 47
| | Red | Green | Blue
| | z | | 18.32
| | znorm | | 14.14
| | sky | 15.2 | 14.9 | 15.0
| | S/N | 9.9 | 16.5 | 17.6
| | S/N(c) | 8.4 | 15.4 | 15.9
| | SN(E/C) 0.94
|
| 
| 
| 
| 
| 
|
| 3100083
| 47
| | Red | Green | Blue
| | z | | 18.53
| | znorm | | 14.34
| | sky | 14.8 | 14.9 | 14.8
| | S/N | 11.6 | 18.4 | 20.3
| | S/N(c) | 10.0 | 17.0 | 18.5
| | SN(E/C) 0.95
|
| 
| 
| 
| 
| 
|