| Red | Green | Blue | |
| z | 17.64 | ||
| znorm | Inf | ||
| sky | -Inf | -Inf | -Inf |
| S/N | 18.0 | 32.3 | 33.3 |
| S/N(c) | 0.0 | 0.0 | 0.0 |
| SN(E/C) |
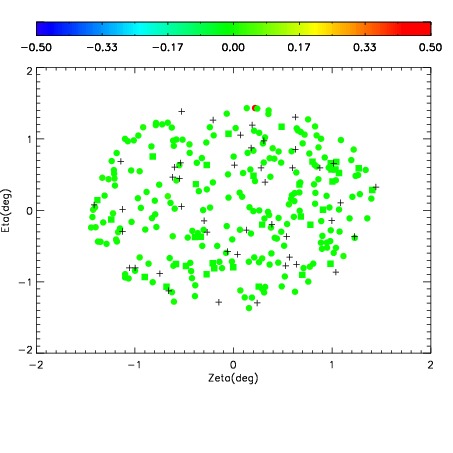
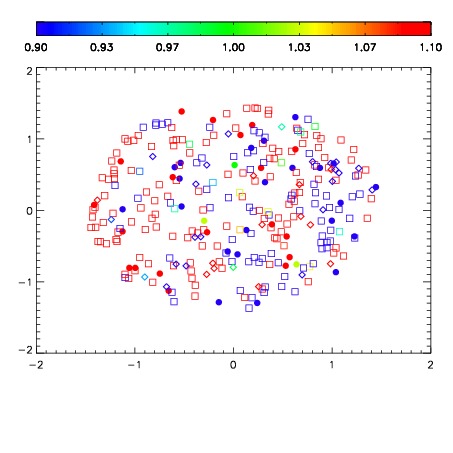
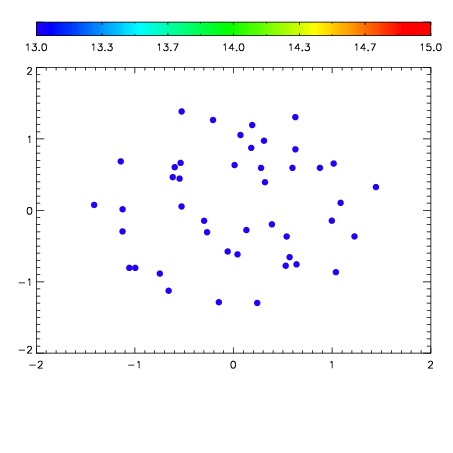

| Frame | Nreads | Zeropoints | Mag plots | Spatial mag deviation | Spatial sky 16325A emission deviations (filled: sky, open: star) | Spatial sky continuum emission | Spatial sky telluric CO2 absorption deviations (filled: H < 10) | |||||||||||||||||||||||
| 0 | 0 |
|
|
|
|
|
|
| IPAIR | NAME | SHIFT | NEWSHIFT | S/N | NAME | SHIFT | NEWSHIFT | S/N |
| 0 | 03100082 | 0.502987 | 0.00000 | 154.022 | 03100083 | 0.00438165 | 0.498605 | 170.480 |
| 1 | 03100077 | 0.500338 | 0.00264901 | 173.067 | 03100079 | 0.00676337 | 0.496224 | 177.808 |
| 2 | 03100081 | 0.502098 | 0.000889003 | 158.746 | 03100080 | 0.00633427 | 0.496653 | 175.487 |
| 3 | 03100078 | 0.501021 | 0.00196600 | 104.342 | 03100076 | 0.00000 | 0.502987 | 167.711 |