| Red | Green | Blue | |
| z | 17.64 | ||
| znorm | Inf | ||
| sky | -Inf | -Inf | -Inf |
| S/N | 36.7 | 59.6 | 68.6 |
| S/N(c) | 0.0 | 0.0 | 0.0 |
| SN(E/C) |
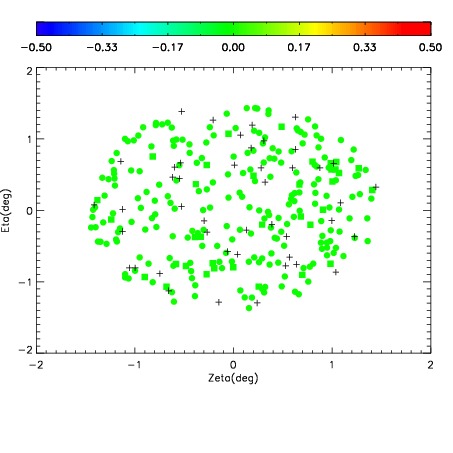
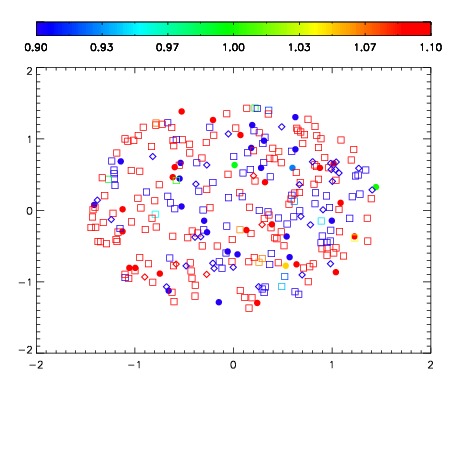
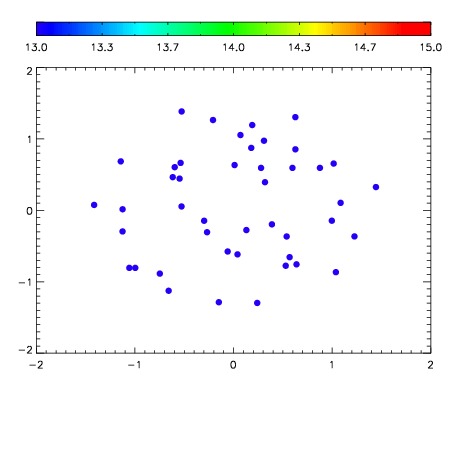

| Frame | Nreads | Zeropoints | Mag plots | Spatial mag deviation | Spatial sky 16325A emission deviations (filled: sky, open: star) | Spatial sky continuum emission | Spatial sky telluric CO2 absorption deviations (filled: H < 10) | |||||||||||||||||||||||
| 0 | 0 |
|
|
|
|
|
|
| IPAIR | NAME | SHIFT | NEWSHIFT | S/N | NAME | SHIFT | NEWSHIFT | S/N |
| 0 | 04030042 | 0.509961 | 0.00000 | 244.672 | 04030040 | -0.00114837 | 0.511109 | 246.209 |
| 1 | 04030038 | 0.495870 | 0.0140910 | 243.903 | 04030043 | -0.000128382 | 0.510089 | 241.395 |
| 2 | 04030037 | 0.495337 | 0.0146240 | 243.300 | 04030047 | 0.00435959 | 0.505601 | 241.379 |
| 3 | 04030046 | 0.507706 | 0.00225502 | 242.617 | 04030039 | -0.000676619 | 0.510638 | 239.159 |
| 4 | 04030041 | 0.502342 | 0.00761902 | 241.844 | 04030036 | 0.00000 | 0.509961 | 239.016 |
| 5 | 04030045 | 0.506268 | 0.00369298 | 240.308 | 04030044 | -0.000535600 | 0.510497 | 234.070 |