| Red | Green | Blue | |
| z | 17.64 | ||
| znorm | Inf | ||
| sky | -NaN | -Inf | -Inf |
| S/N | 28.0 | 48.0 | 50.8 |
| S/N(c) | 0.0 | 0.0 | 0.0 |
| SN(E/C) |
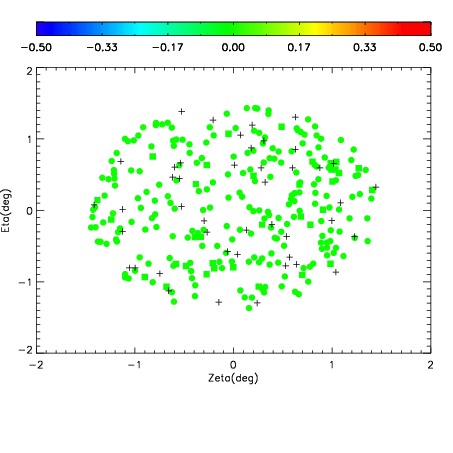
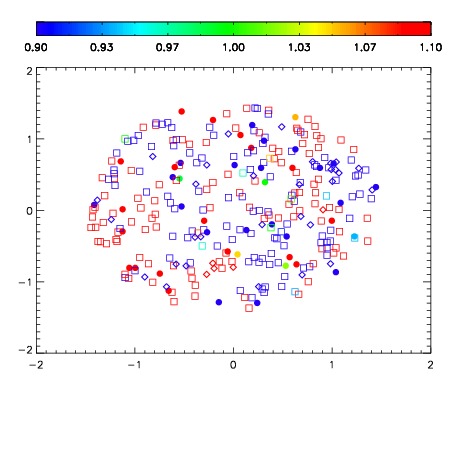
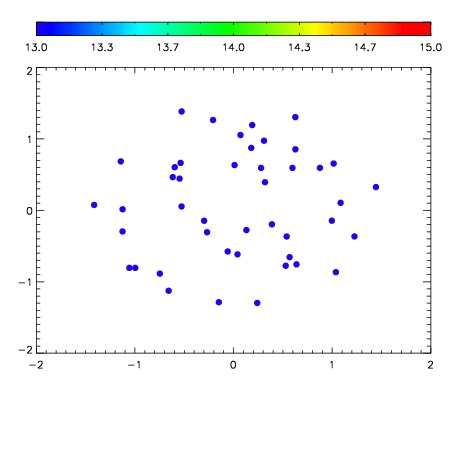

| Frame | Nreads | Zeropoints | Mag plots | Spatial mag deviation | Spatial sky 16325A emission deviations (filled: sky, open: star) | Spatial sky continuum emission | Spatial sky telluric CO2 absorption deviations (filled: H < 10) | |||||||||||||||||||||||
| 0 | 0 |
|
|
|
|
|
|
| IPAIR | NAME | SHIFT | NEWSHIFT | S/N | NAME | SHIFT | NEWSHIFT | S/N |
| 0 | 11140056 | 0.489998 | 0.00000 | 230.860 | 11140050 | 0.00000 | 0.489998 | 220.617 |
| 1 | 11140055 | 0.488776 | 0.00122201 | 236.947 | 11140053 | 0.00139570 | 0.488602 | 238.306 |
| 2 | 11140052 | 0.485890 | 0.00410801 | 234.926 | 11140054 | 0.00135284 | 0.488645 | 236.163 |
| 3 | 11140051 | 0.485273 | 0.00472501 | 234.519 | 11140057 | 0.00284776 | 0.487150 | 232.622 |