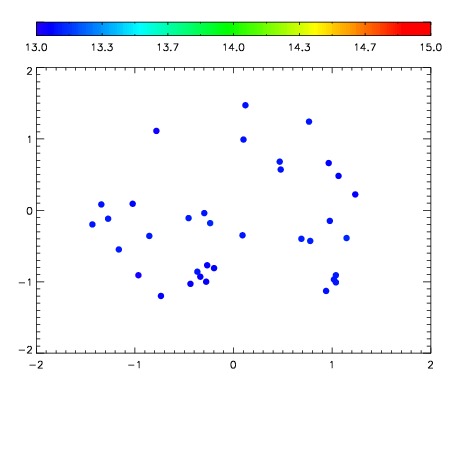
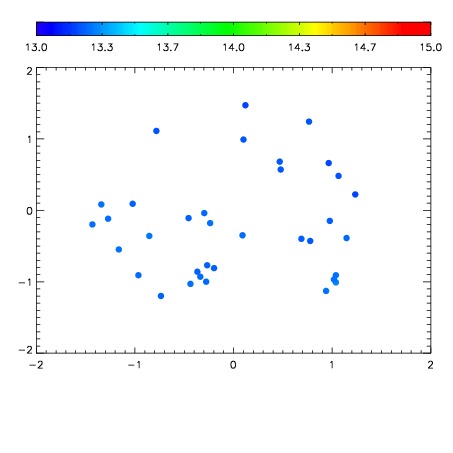
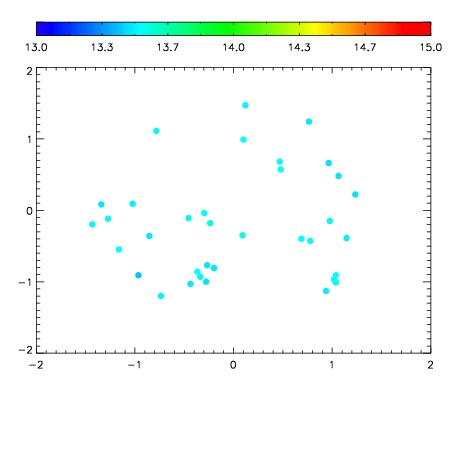
| Frame | Nreads | Zeropoints | Mag plots
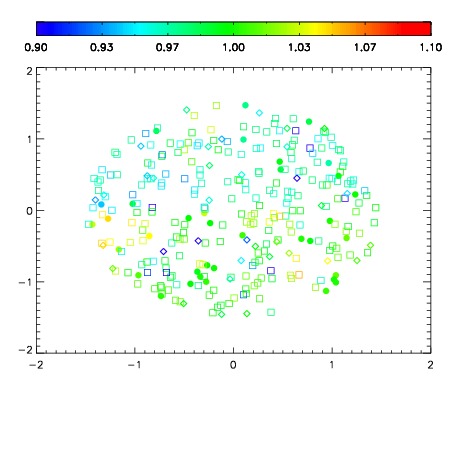
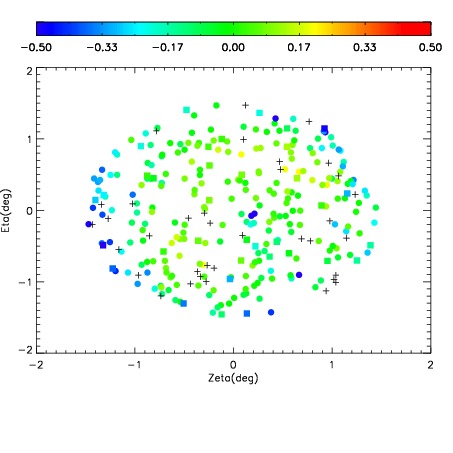
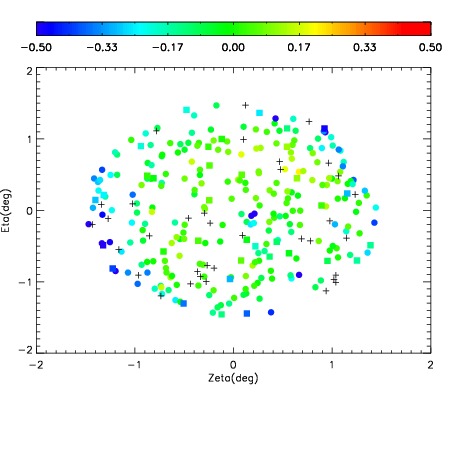
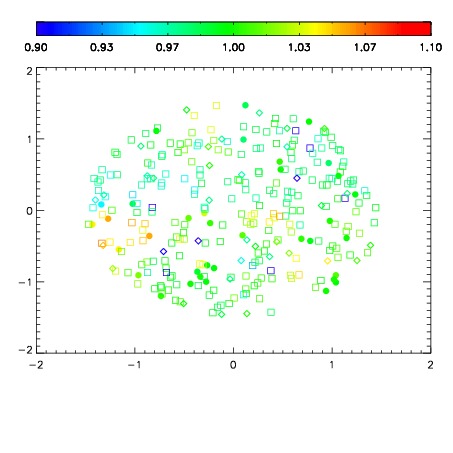
| Spatial mag deviation
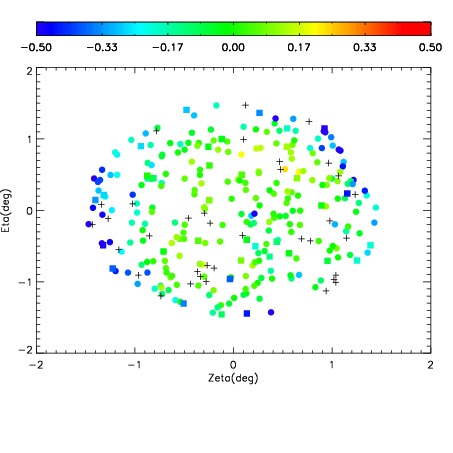
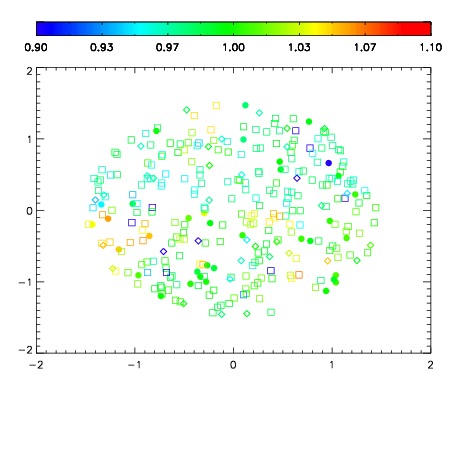
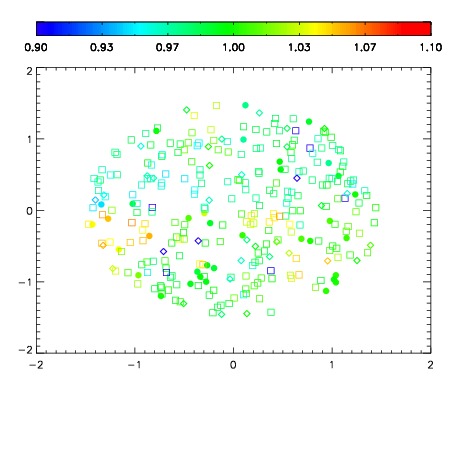
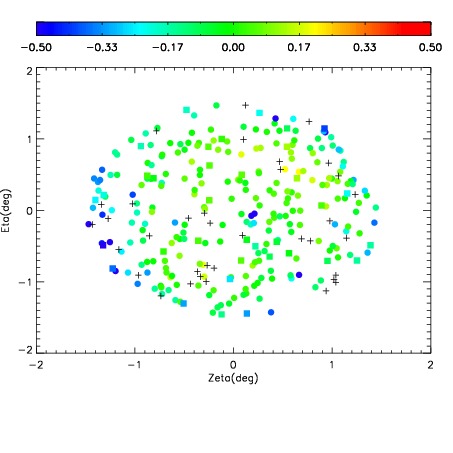
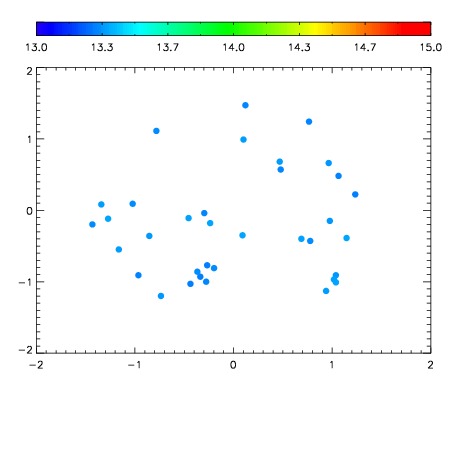
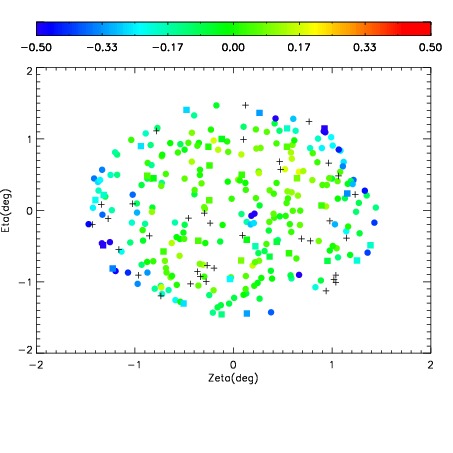
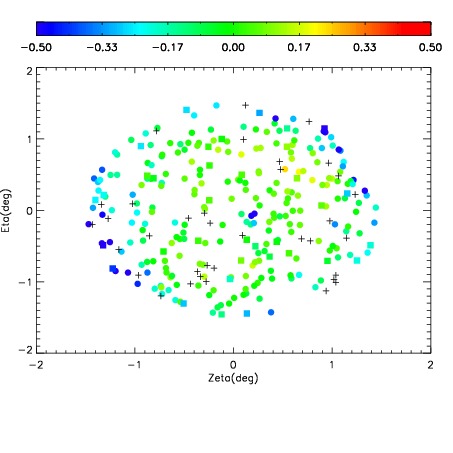
| Spatial sky 16325A emission deviations (filled: sky, open: star)
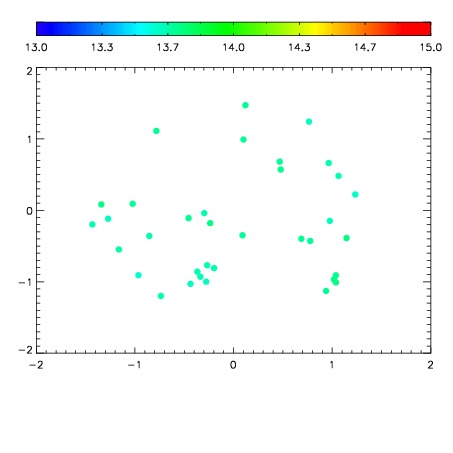
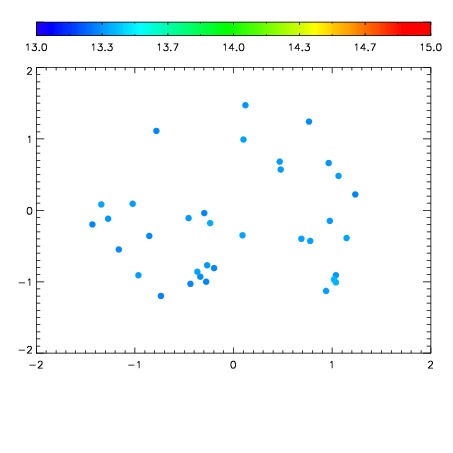
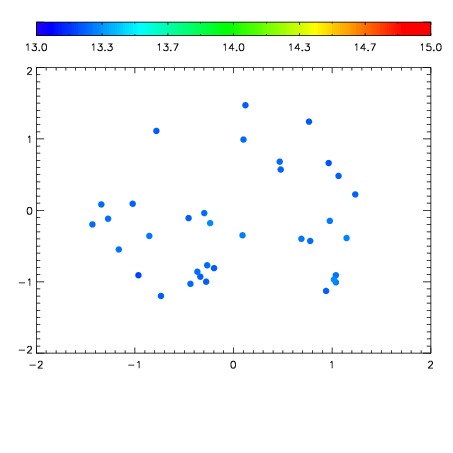
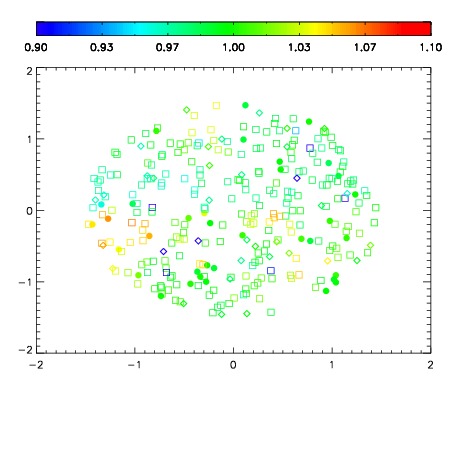
| Spatial sky continuum emission
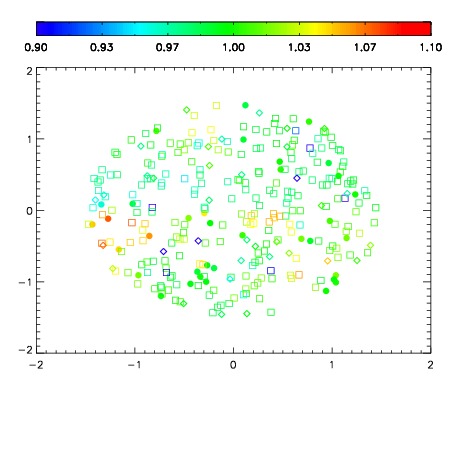
| Spatial sky telluric CO2 absorption deviations (filled: H < 10)
|
| 3140084
| 47
| | Red | Green | Blue
| | z | | 18.32
| | znorm | | 14.14
| | sky | 13.8 | 13.7 | 13.3
| | S/N | 9.6 | 15.7 | 16.8
| | S/N(c) | 8.2 | 14.4 | 18.0
| | SN(E/C) 0.99
|
| 
| 
| 
| 
| 
|
| 3140085
| 47
| | Red | Green | Blue
| | z | | 17.85
| | znorm | | 13.67
| | sky | 13.6 | 13.5 | 13.3
| | S/N | 6.3 | 10.9 | 13.1
| | S/N(c) | 5.4 | 9.8 | 14.5
| | SN(E/C) 1.01
|
| 
| 
| 
| 
| 
|
| 3140086
| 47
| | Red | Green | Blue
| | z | | 17.49
| | znorm | | 13.31
| | sky | 13.4 | 13.3 | 13.3
| | S/N | 4.5 | 7.8 | 10.7
| | S/N(c) | 4.0 | 7.1 | 11.8
| | SN(E/C) 1.00
|
| 
| 
| 
| 
| 
|
| 3140087
| 47
| | Red | Green | Blue
| | z | | 17.34
| | znorm | | 13.16
| | sky | 13.4 | 13.3 | 13.2
| | S/N | 3.9 | 6.6 | 9.9
| | S/N(c) | 3.6 | 6.2 | 11.0
| | SN(E/C) 1.03
|
| 
| 
| 
| 
| 
|
| 3140088
| 47
| | Red | Green | Blue
| | z | | 17.39
| | znorm | | 13.21
| | sky | 13.4 | 13.3 | 13.3
| | S/N | 4.3 | 7.4 | 9.9
| | S/N(c) | 3.8 | 6.7 | 11.0
| | SN(E/C) 0.98
|
| 
| 
| 
| 
| 
|
| 3140089
| 47
| | Red | Green | Blue
| | z | | 17.09
| | znorm | | 12.91
| | sky | 13.2 | 13.1 | 13.1
| | S/N | 2.9 | 5.4 | 8.3
| | S/N(c) | 2.7 | 5.0 | 9.4
| | SN(E/C) 1.00
|
| 
| 
| 
| 
| 
|
| 3140090
| 47
| | Red | Green | Blue
| | z | | 17.39
| | znorm | | 13.21
| | sky | 13.3 | 13.2 | 13.2
| | S/N | 4.1 | 7.2 | 9.9
| | S/N(c) | 3.6 | 6.4 | 10.7
| | SN(E/C) 0.99
|
| 
| 
| 
| 
| 
|
| 3140091
| 47
| | Red | Green | Blue
| | z | | 18.03
| | znorm | | 13.85
| | sky | 13.5 | 13.5 | 13.4
| | S/N | 7.4 | 12.5 | 14.2
| | S/N(c) | 6.5 | 11.4 | 15.0
| | SN(E/C) 1.00
|
| 
| 
| 
| 
| 
|