| Red | Green | Blue | |
| z | 17.64 | ||
| znorm | Inf | ||
| sky | -Inf | -Inf | -Inf |
| S/N | 9.5 | 16.7 | 25.2 |
| S/N(c) | 0.0 | 0.0 | 0.0 |
| SN(E/C) |
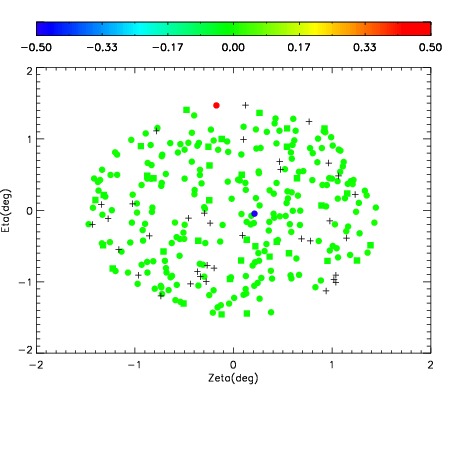
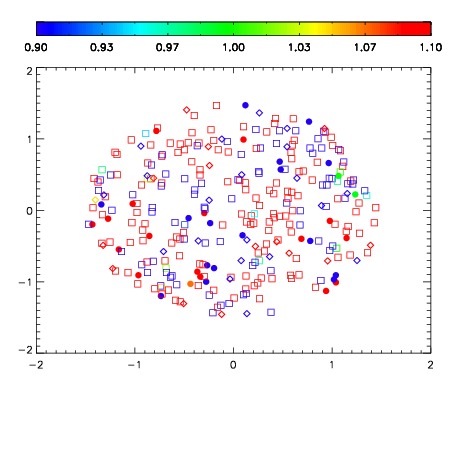
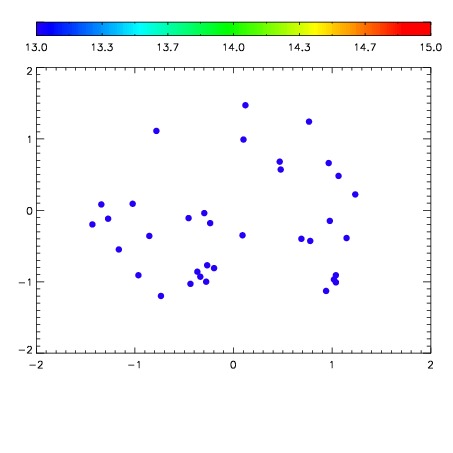

| Frame | Nreads | Zeropoints | Mag plots | Spatial mag deviation | Spatial sky 16325A emission deviations (filled: sky, open: star) | Spatial sky continuum emission | Spatial sky telluric CO2 absorption deviations (filled: H < 10) | |||||||||||||||||||||||
| 0 | 0 |
|
|
|
|
|
|
| IPAIR | NAME | SHIFT | NEWSHIFT | S/N | NAME | SHIFT | NEWSHIFT | S/N |
| 0 | 03140086 | 0.512338 | 0.00000 | 100.410 | 03140091 | -0.000189507 | 0.512527 | 131.520 |
| 1 | 03140085 | 0.509278 | 0.00305998 | 119.520 | 03140084 | 0.00000 | 0.512338 | 148.822 |
| 2 | 03140090 | 0.510992 | 0.00134599 | 96.0912 | 03140088 | 0.00921809 | 0.503120 | 95.7573 |
| 3 | 03140089 | 0.506244 | 0.00609398 | 82.8000 | 03140087 | 0.0102245 | 0.502113 | 93.4266 |