| Red | Green | Blue | |
| z | 17.64 | ||
| znorm | Inf | ||
| sky | -Inf | -Inf | -Inf |
| S/N | 28.1 | 48.3 | 52.9 |
| S/N(c) | 0.0 | 0.0 | 0.0 |
| SN(E/C) |
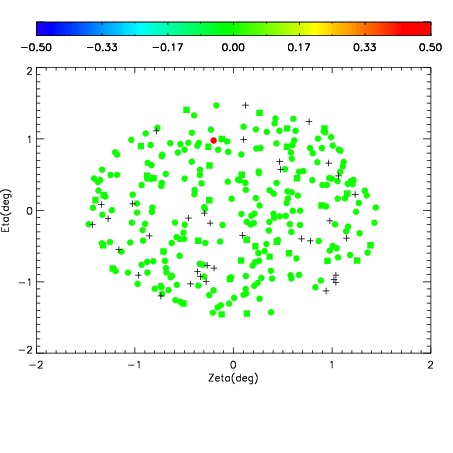
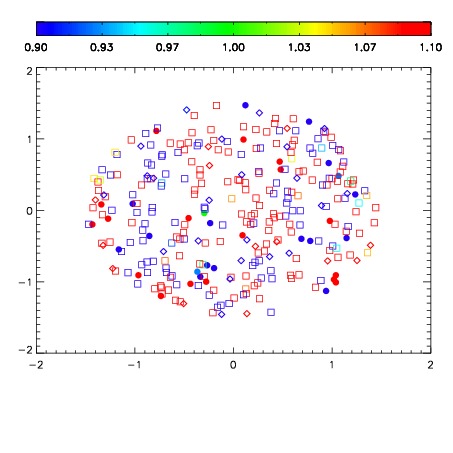
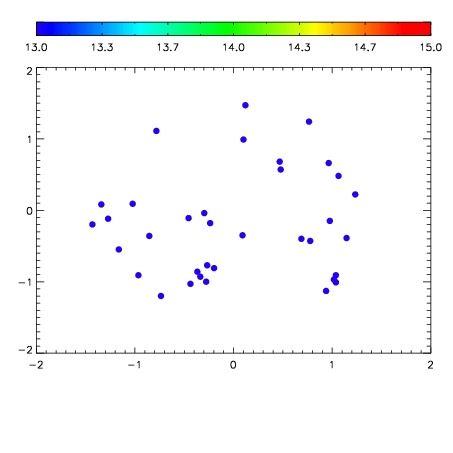

| Frame | Nreads | Zeropoints | Mag plots | Spatial mag deviation | Spatial sky 16325A emission deviations (filled: sky, open: star) | Spatial sky continuum emission | Spatial sky telluric CO2 absorption deviations (filled: H < 10) | |||||||||||||||||||||||
| 0 | 0 |
|
|
|
|
|
|
| IPAIR | NAME | SHIFT | NEWSHIFT | S/N | NAME | SHIFT | NEWSHIFT | S/N |
| 0 | 03190073 | 0.513946 | 0.00000 | 217.918 | 03190074 | 0.00165290 | 0.512293 | 215.186 |
| 1 | 03190069 | 0.502988 | 0.0109580 | 226.444 | 03190067 | 0.00000 | 0.513946 | 222.267 |
| 2 | 03190068 | 0.501899 | 0.0120470 | 226.413 | 03190070 | 0.000183806 | 0.513762 | 218.668 |
| 3 | 03190072 | 0.502784 | 0.0111620 | 220.100 | 03190071 | -0.000633467 | 0.514579 | 216.412 |