| Red | Green | Blue | |
| z | 17.64 | ||
| znorm | Inf | ||
| sky | -Inf | -Inf | -Inf |
| S/N | 26.0 | 45.3 | 54.2 |
| S/N(c) | 0.0 | 0.0 | 0.0 |
| SN(E/C) |

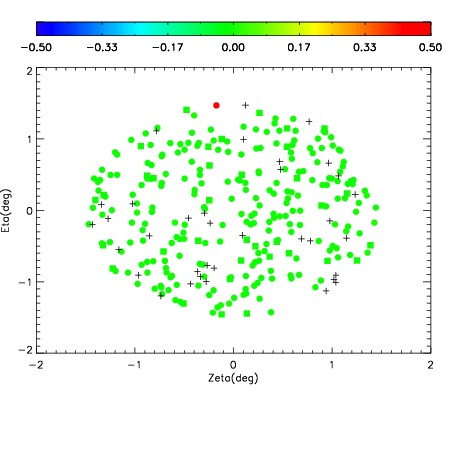
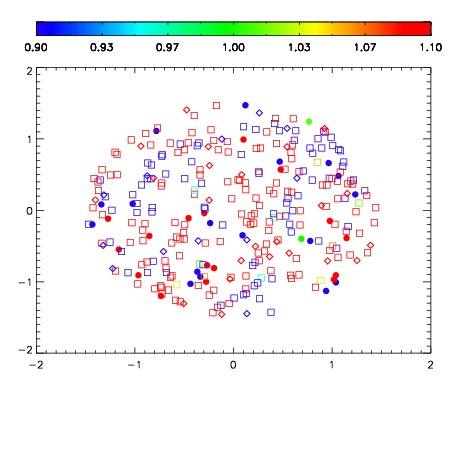
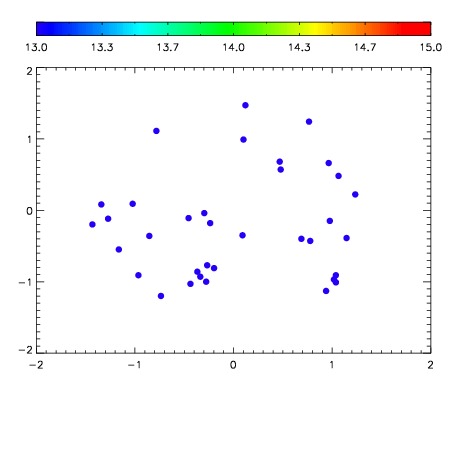

| Frame | Nreads | Zeropoints | Mag plots | Spatial mag deviation | Spatial sky 16325A emission deviations (filled: sky, open: star) | Spatial sky continuum emission | Spatial sky telluric CO2 absorption deviations (filled: H < 10) | |||||||||||||||||||||||
| 0 | 0 |
|
|
|
|
|
|
| IPAIR | NAME | SHIFT | NEWSHIFT | S/N | NAME | SHIFT | NEWSHIFT | S/N |
| 0 | 03400042 | 0.503623 | 0.00000 | 209.337 | 03400040 | 2.95778e-05 | 0.503593 | 209.394 |
| 1 | 03400038 | 0.497609 | 0.00601402 | 225.258 | 03400036 | 0.00000 | 0.503623 | 223.035 |
| 2 | 03400037 | 0.496091 | 0.00753200 | 224.067 | 03400039 | 0.00245856 | 0.501164 | 222.816 |
| 3 | 03400041 | 0.500171 | 0.00345200 | 211.721 | 03400043 | 0.00289987 | 0.500723 | 211.005 |