| Frame | Nreads | Zeropoints | Mag plots
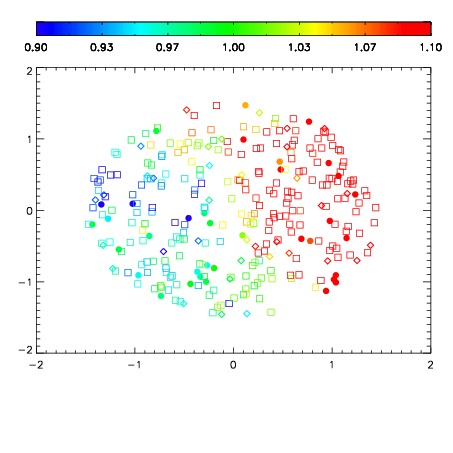
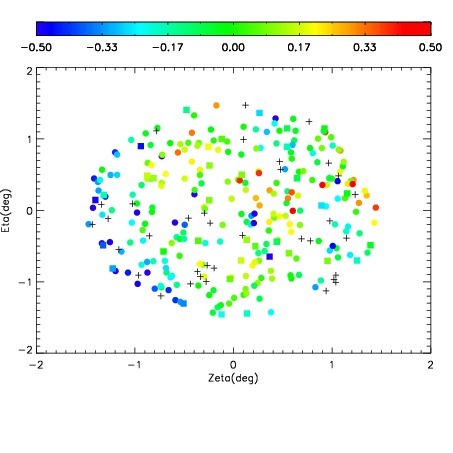
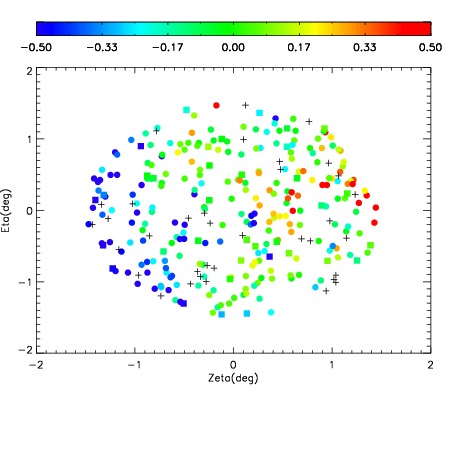
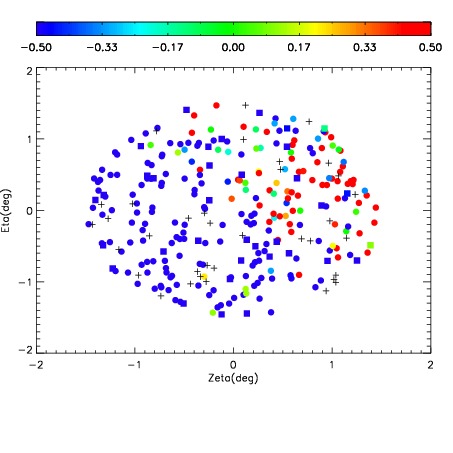
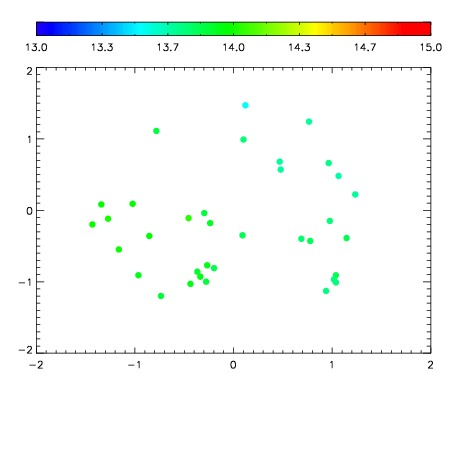
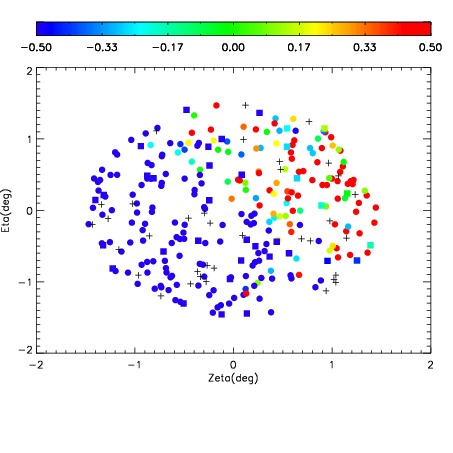
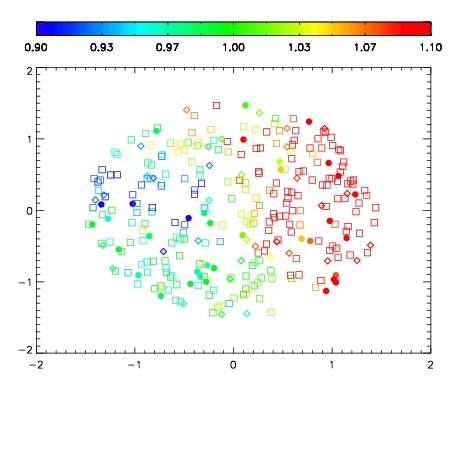
| Spatial mag deviation
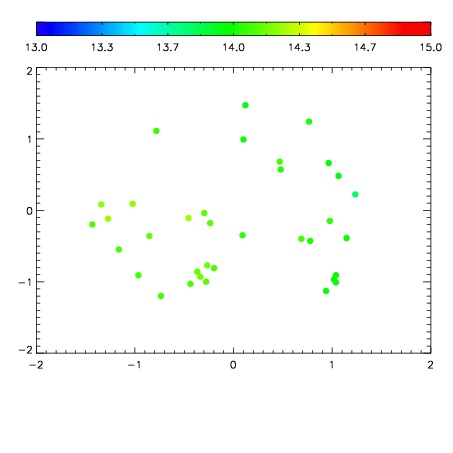
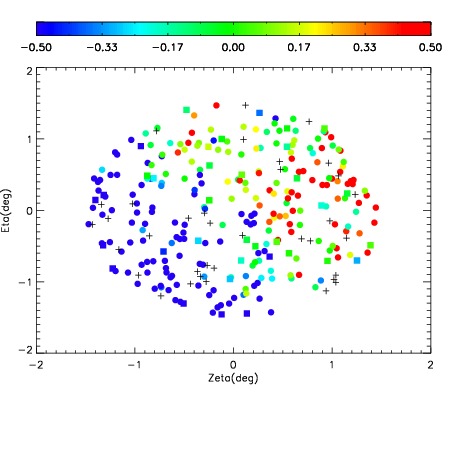
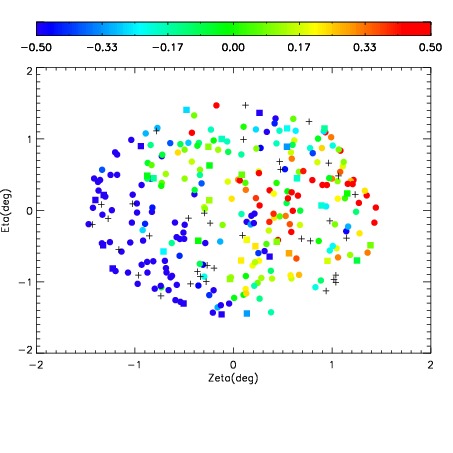
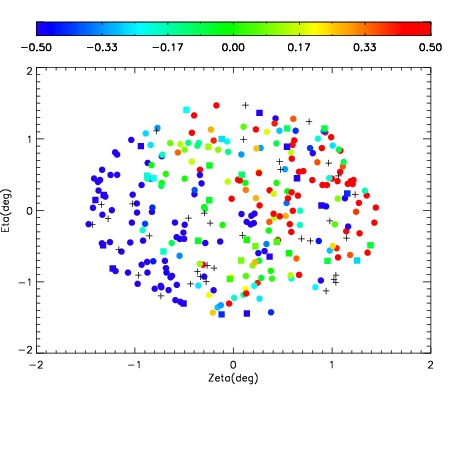
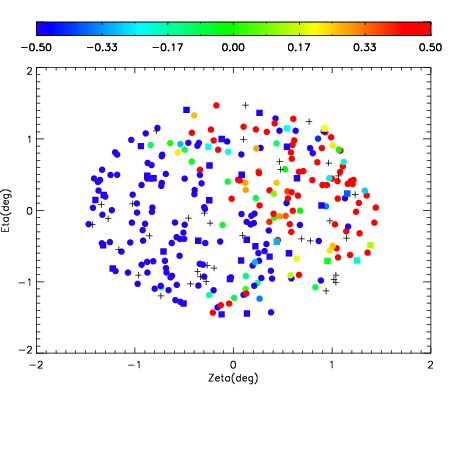
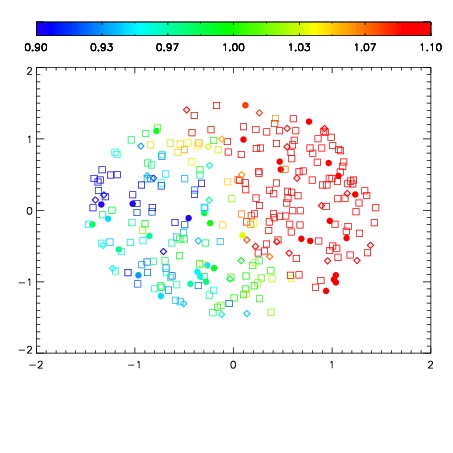
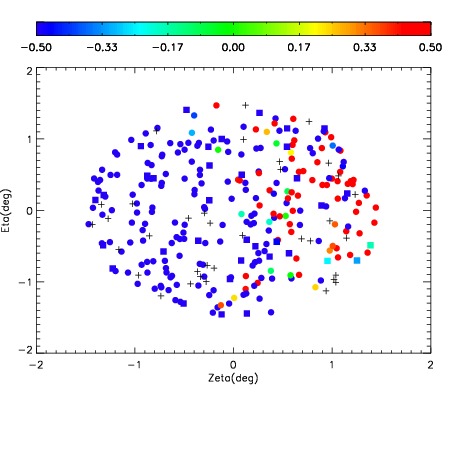
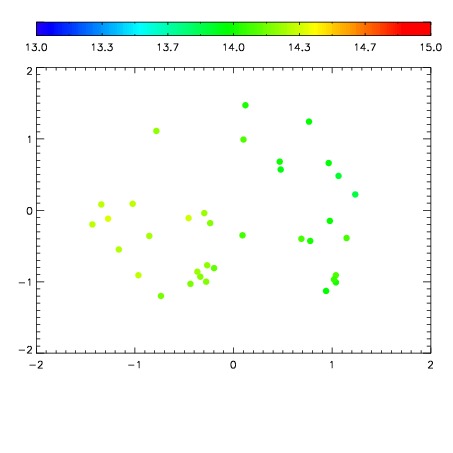
| Spatial sky 16325A emission deviations (filled: sky, open: star)
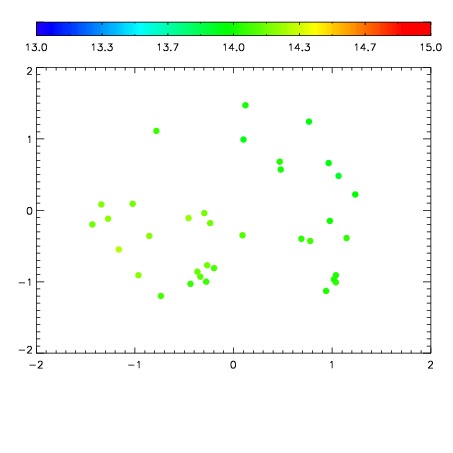
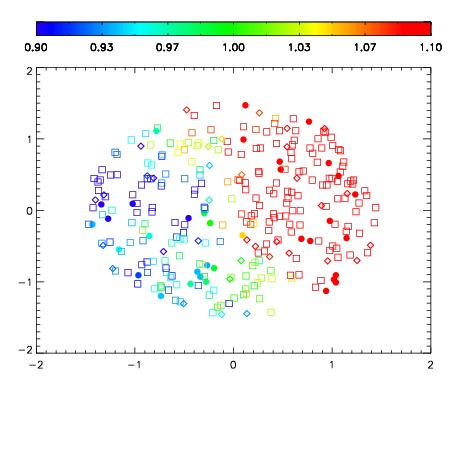
| Spatial sky continuum emission
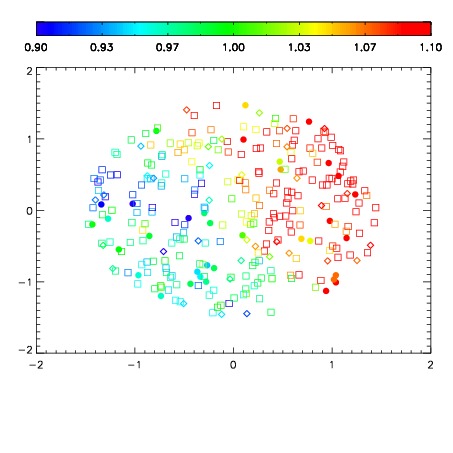
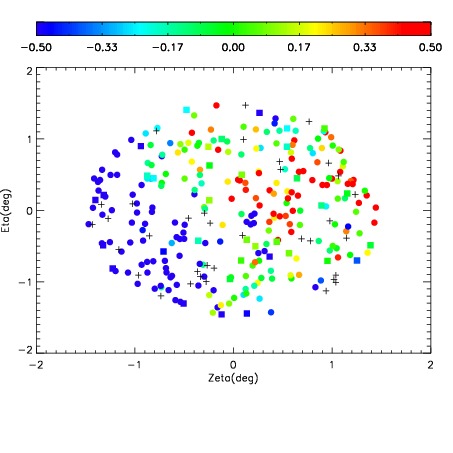
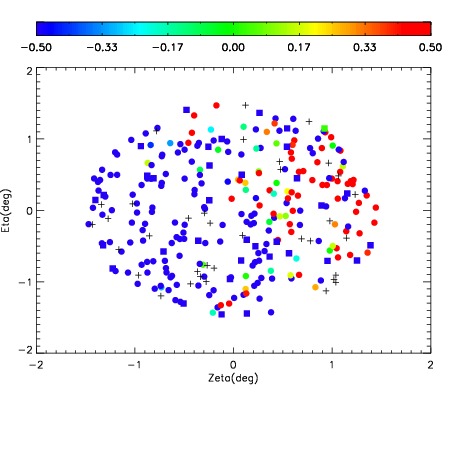
| Spatial sky telluric CO2 absorption deviations (filled: H < 10)
|
| 3500040
| 47
| | Red | Green | Blue
| | z | | 16.67
| | znorm | | 12.49
| | sky | 14.2 | 14.1 | 13.9
| | S/N | 2.5 | 5.5 | 7.1
| | S/N(c) | 2.1 | 4.4 | 7.0
| | SN(E/C) 1.04
|
| 
| 
| 
| 
| 
|
| 3500041
| 47
| | Red | Green | Blue
| | z | | 17.03
| | znorm | | 12.85
| | sky | 14.3 | 14.1 | 14.1
| | S/N | 3.6 | 6.6 | 8.7
| | S/N(c) | 2.9 | 5.4 | 8.3
| | SN(E/C) 0.98
|
| 
| 
| 
| 
| 
|
| 3500042
| 47
| | Red | Green | Blue
| | z | | 16.59
| | znorm | | 12.41
| | sky | 14.1 | 14.0 | 14.0
| | S/N | 2.6 | 5.1 | 6.8
| | S/N(c) | 2.1 | 4.0 | 6.5
| | SN(E/C) 1.01
|
| 
| 
| 
| 
| 
|
| 3500043
| 47
| | Red | Green | Blue
| | z | | 15.41
| | znorm | | 11.23
| | sky | 13.9 | 13.8 | 14.1
| | S/N | 1.0 | 1.9 | 3.8
| | S/N(c) | 0.8 | 1.5 | 4.0
| | SN(E/C) 0.96
|
| 
| 
| 
| 
| 
|
| 3500044
| 47
| | Red | Green | Blue
| | z | | 14.14
| | znorm | | 9.96
| | sky | 14.0 | 14.1 | 14.2
| | S/N | 0.5 | 0.4 | 2.6
| | S/N(c) | 0.0 | 0.0 | 0.0
| | SN(E/C) 2.60
|
| 
| 
| 
| 
| 
|
| 3500045
| 47
| | Red | Green | Blue
| | z | | 15.81
| | znorm | | 11.63
| | sky | 13.9 | 13.8 | 14.0
| | S/N | 1.5 | 2.8 | 4.5
| | S/N(c) | 0.0 | 0.0 | 0.0
| | SN(E/C) 0.83
|
| 
| 
| 
| 
| 
|
| 3500046
| 47
| | Red | Green | Blue
| | z | | 15.18
| | znorm | | 11.00
| | sky | 13.8 | 13.8 | 13.9
| | S/N | 0.7 | 1.9 | 3.5
| | S/N(c) | 0.0 | 0.0 | 0.0
| | SN(E/C) 1.21
|
| 
| 
| 
| 
| 
|
| 3500047
| 47
| | Red | Green | Blue
| | z | | 14.56
| | znorm | | 10.38
| | sky | 13.8 | 13.9 | 14.0
| | S/N | 0.4 | 0.9 | 2.5
| | S/N(c) | 0.0 | 0.0 | 0.0
| | SN(E/C) 1.66
|
| 
| 
| 
| 
| 
|
| 3500048
| 47
| | Red | Green | Blue
| | z | | 15.54
| | znorm | | 11.36
| | sky | 14.0 | 13.9 | 14.0
| | S/N | 1.0 | 2.3 | 3.5
| | S/N(c) | 0.9 | 1.7 | 3.6
| | SN(E/C) 0.93
|
| 
| 
| 
| 
| 
|
| 3500049
| 47
| | Red | Green | Blue
| | z | | 14.80
| | znorm | | 10.62
| | sky | 13.9 | 13.8 | 13.9
| | S/N | 0.4 | 0.8 | 2.2
| | S/N(c) | 0.2 | 0.1 | 2.5
| | SN(E/C) 0.99
|
| 
| 
| 
| 
| 
|
| 3500050
| 47
| | Red | Green | Blue
| | z | | 14.29
| | znorm | | 10.11
| | sky | 13.9 | 13.9 | 14.1
| | S/N | 0.3 | 0.5 | 2.0
| | S/N(c) | 0.0 | 0.0 | 0.0
| | SN(E/C) 3.17
|
| 
| 
| 
| 
| 
|
| 3500051
| 47
| | Red | Green | Blue
| | z | | 14.28
| | znorm | | 10.10
| | sky | 14.0 | 14.2 | 14.4
| | S/N | 0.5 | 1.0 | 2.3
| | S/N(c) | 0.0 | 0.0 | 0.0
| | SN(E/C) 3.69
|
| 
| 
| 
| 
| 
|