| Red | Green | Blue | |
| z | 17.64 | ||
| znorm | Inf | ||
| sky | -Inf | -Inf | -Inf |
| S/N | 2.8 | 5.9 | 9.8 |
| S/N(c) | 0.0 | 0.0 | 0.0 |
| SN(E/C) |
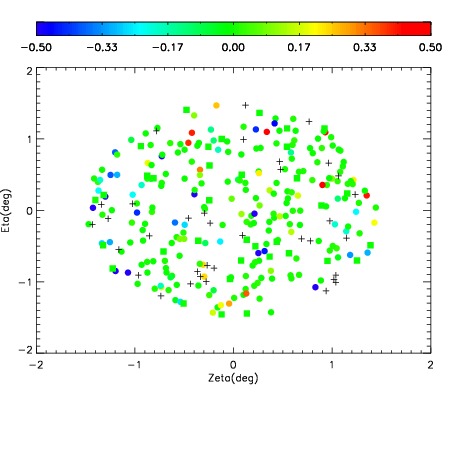
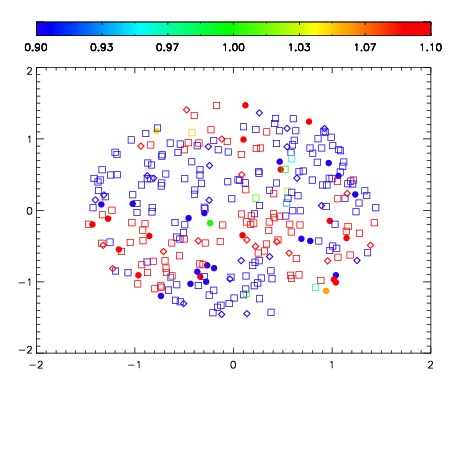
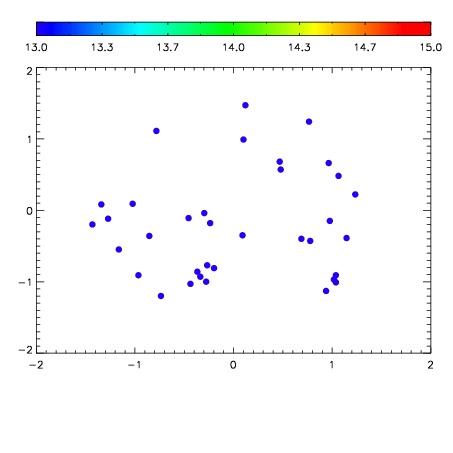

| Frame | Nreads | Zeropoints | Mag plots | Spatial mag deviation | Spatial sky 16325A emission deviations (filled: sky, open: star) | Spatial sky continuum emission | Spatial sky telluric CO2 absorption deviations (filled: H < 10) | |||||||||||||||||||||||
| 0 | 0 |
|
|
|
|
|
|
| IPAIR | NAME | SHIFT | NEWSHIFT | S/N | NAME | SHIFT | NEWSHIFT | S/N |
| 0 | 03500042 | 0.511929 | 0.00000 | 68.0531 | 03500048 | 0.000396922 | 0.511532 | 39.9556 |
| 1 | 03500041 | 0.504398 | 0.00753099 | 85.7814 | 03500040 | 0.00000 | 0.511929 | 68.4633 |
| 2 | 03500049 | 0.502970 | 0.00895900 | 8.21502 | 03500043 | -0.000403711 | 0.512333 | 35.0517 |