| Red | Green | Blue | |
| z | 17.64 | ||
| znorm | Inf | ||
| sky | -Inf | -Inf | -Inf |
| S/N | 32.3 | 54.5 | 60.7 |
| S/N(c) | 0.0 | 0.0 | 0.0 |
| SN(E/C) |
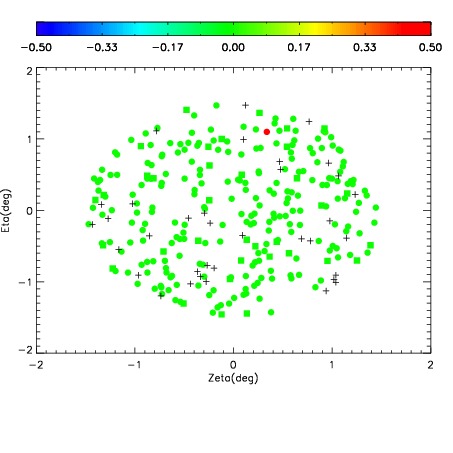
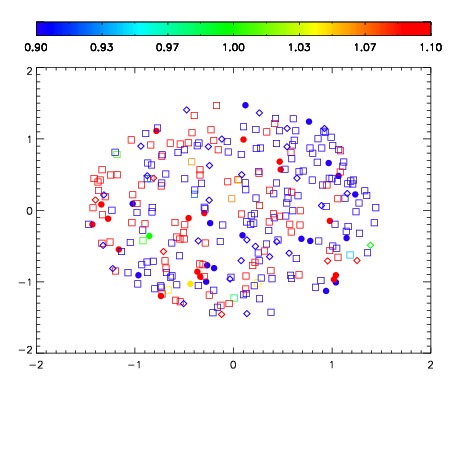
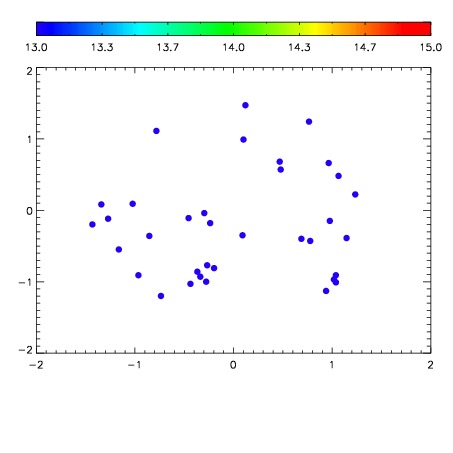

| Frame | Nreads | Zeropoints | Mag plots | Spatial mag deviation | Spatial sky 16325A emission deviations (filled: sky, open: star) | Spatial sky continuum emission | Spatial sky telluric CO2 absorption deviations (filled: H < 10) | |||||||||||||||||||||||
| 0 | 0 |
|
|
|
|
|
|
| IPAIR | NAME | SHIFT | NEWSHIFT | S/N | NAME | SHIFT | NEWSHIFT | S/N |
| 0 | 03660052 | 0.502825 | 0.00000 | 252.925 | 03660054 | 0.00139863 | 0.501426 | 254.101 |
| 1 | 03660056 | 0.501930 | 0.000895023 | 257.075 | 03660057 | 0.00208889 | 0.500736 | 257.686 |
| 2 | 03660055 | 0.496825 | 0.00600001 | 256.102 | 03660050 | 0.00000 | 0.502825 | 256.198 |
| 3 | 03660051 | 0.497586 | 0.00523901 | 253.805 | 03660053 | 0.00109727 | 0.501728 | 254.109 |